Newsletter
Join the Community
Subscribe to our newsletter for the latest news and updates

COVID-19 Data PWA built with NextJS, SWR, and Chakra-UI
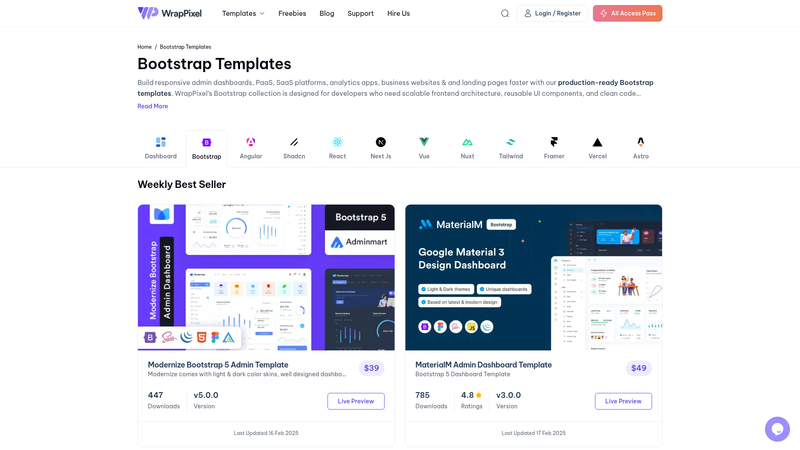
Nice Admin Free is a free, MIT-licensed Bootstrap 5 admin dashboard template from Wrappixel with a basic dashboard, 7+ pages, and 10+ UI components.
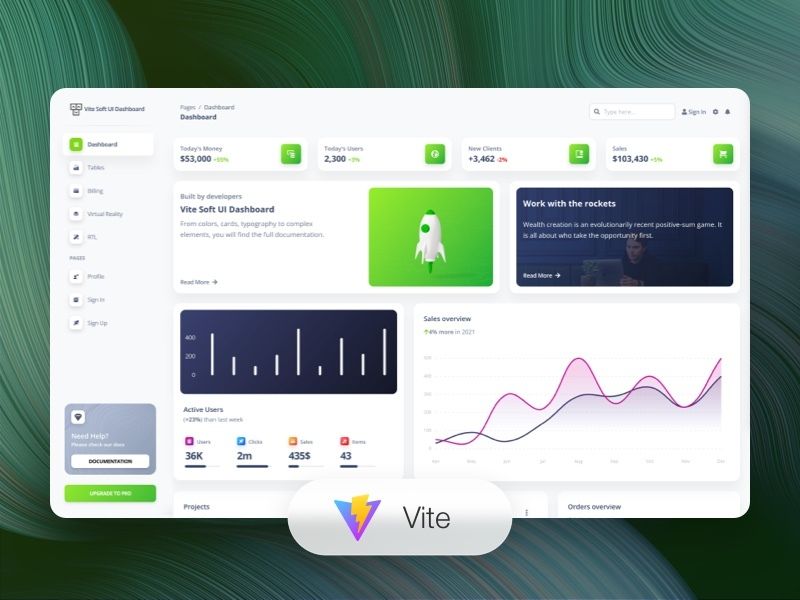
Free Vue 3, Bootstrap 5, and Vite admin dashboard with Soft UI design and 70+ components.
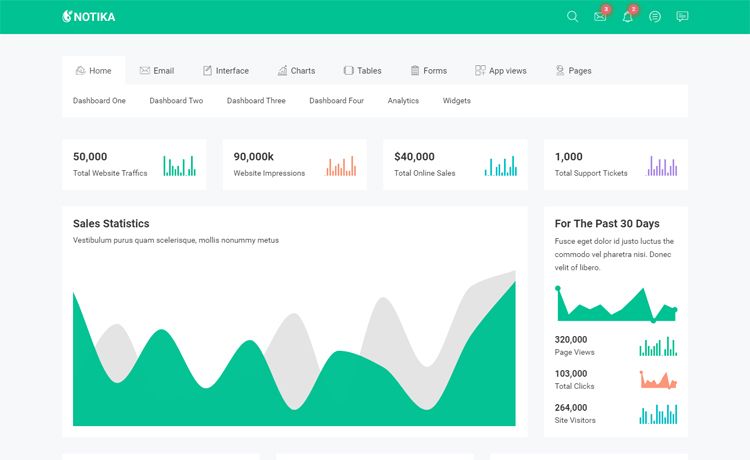
Free Bootstrap 3 admin dashboard template with 40 HTML files, four dashboard layouts, charts, maps, and UI components for backend web apps.
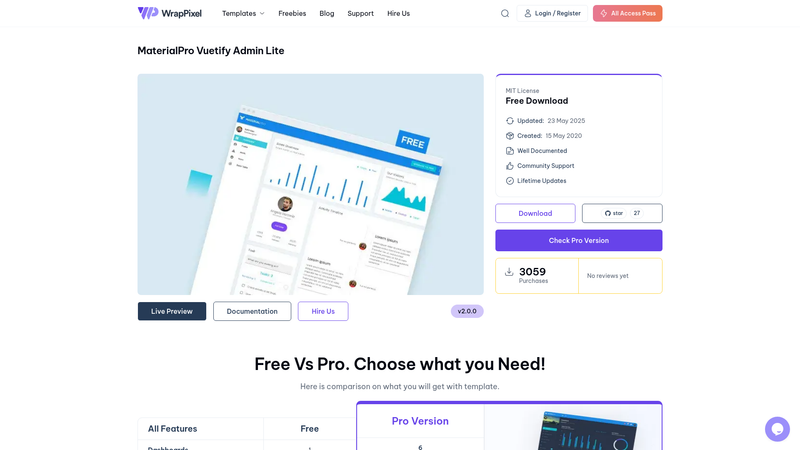
Free Vue 3 admin dashboard template built with Vuetify, Vite, TypeScript, and SASS for responsive admin UIs.
COVID-19 Data is an open-source Progressive Web App dashboard for tracking COVID-19 statistics, built with Next.js, SWR, and Chakra UI, and deployed at covid19.sznm.dev. It was created by developer sozonome and is available as a GitHub repository for reuse or contribution.
The COVID-19 Data App is a web application that fetches pandemic statistics from public APIs and displays them in a responsive dashboard interface. It takes data from @mathdroid's covid-19-api, @ariya's dekontaminasi, and @Reynaldi531's api-covid19-indonesia-v2, producing visual summaries of case counts, recoveries, and deaths. The current v2 release is written in TypeScript using Next.js for routing and server-side rendering, Chakra UI for component styling, and SWR for caching and server state synchronization. The app is designed as a PWA, meaning it can be installed on supported devices and work offline.
src/pages and full TypeScript typings, with the only missing typings being the API response shapes (listed as a to-do).next-pwa configs (marked as completed in release notes), allowing the site to be installed as a Progressive Web App.any type can be removed.next-pwa is configured in a Next.js app to make a dashboard installable and offline-capable.The app runs as a Next.js project; after cloning, you start the development server with pnpm dev and open http://localhost:3000. The dashboard fetches JSON data client-side via SWR from the three public API endpoints, then renders cards and numbers through Chakra UI components. The release notes indicate the site was first built with GatsbyJS and later rewritten to the current Next.js + Chakra-UI stack.
The app pulls from three public APIs: mathdroid's covid-19-api, ariya's dekontaminasi, and Reynaldi531's api-covid19-indonesia-v2. These provide global and Indonesia-specific pandemic statistics.
Clone the repository, install dependencies with pnpm install, then run pnpm dev to start the development server. The page at http://localhost:3000 auto-updates as you edit files in src/pages.
Yes, the v2 release includes next-pwa configuration, which is marked as completed. This enables installability and offline support for the dashboard.
The current version uses Next.js as the framework, Chakra UI for UI components, SWR for data fetching, and TypeScript for static typing. The earlier v1 release instead used GatsbyJS, Evergreen UI, TailwindCSS, and Nivo Charts.
Charts are listed as an in-progress to-do in the release notes. The current version displays numeric data but does not yet include chart visualizations.