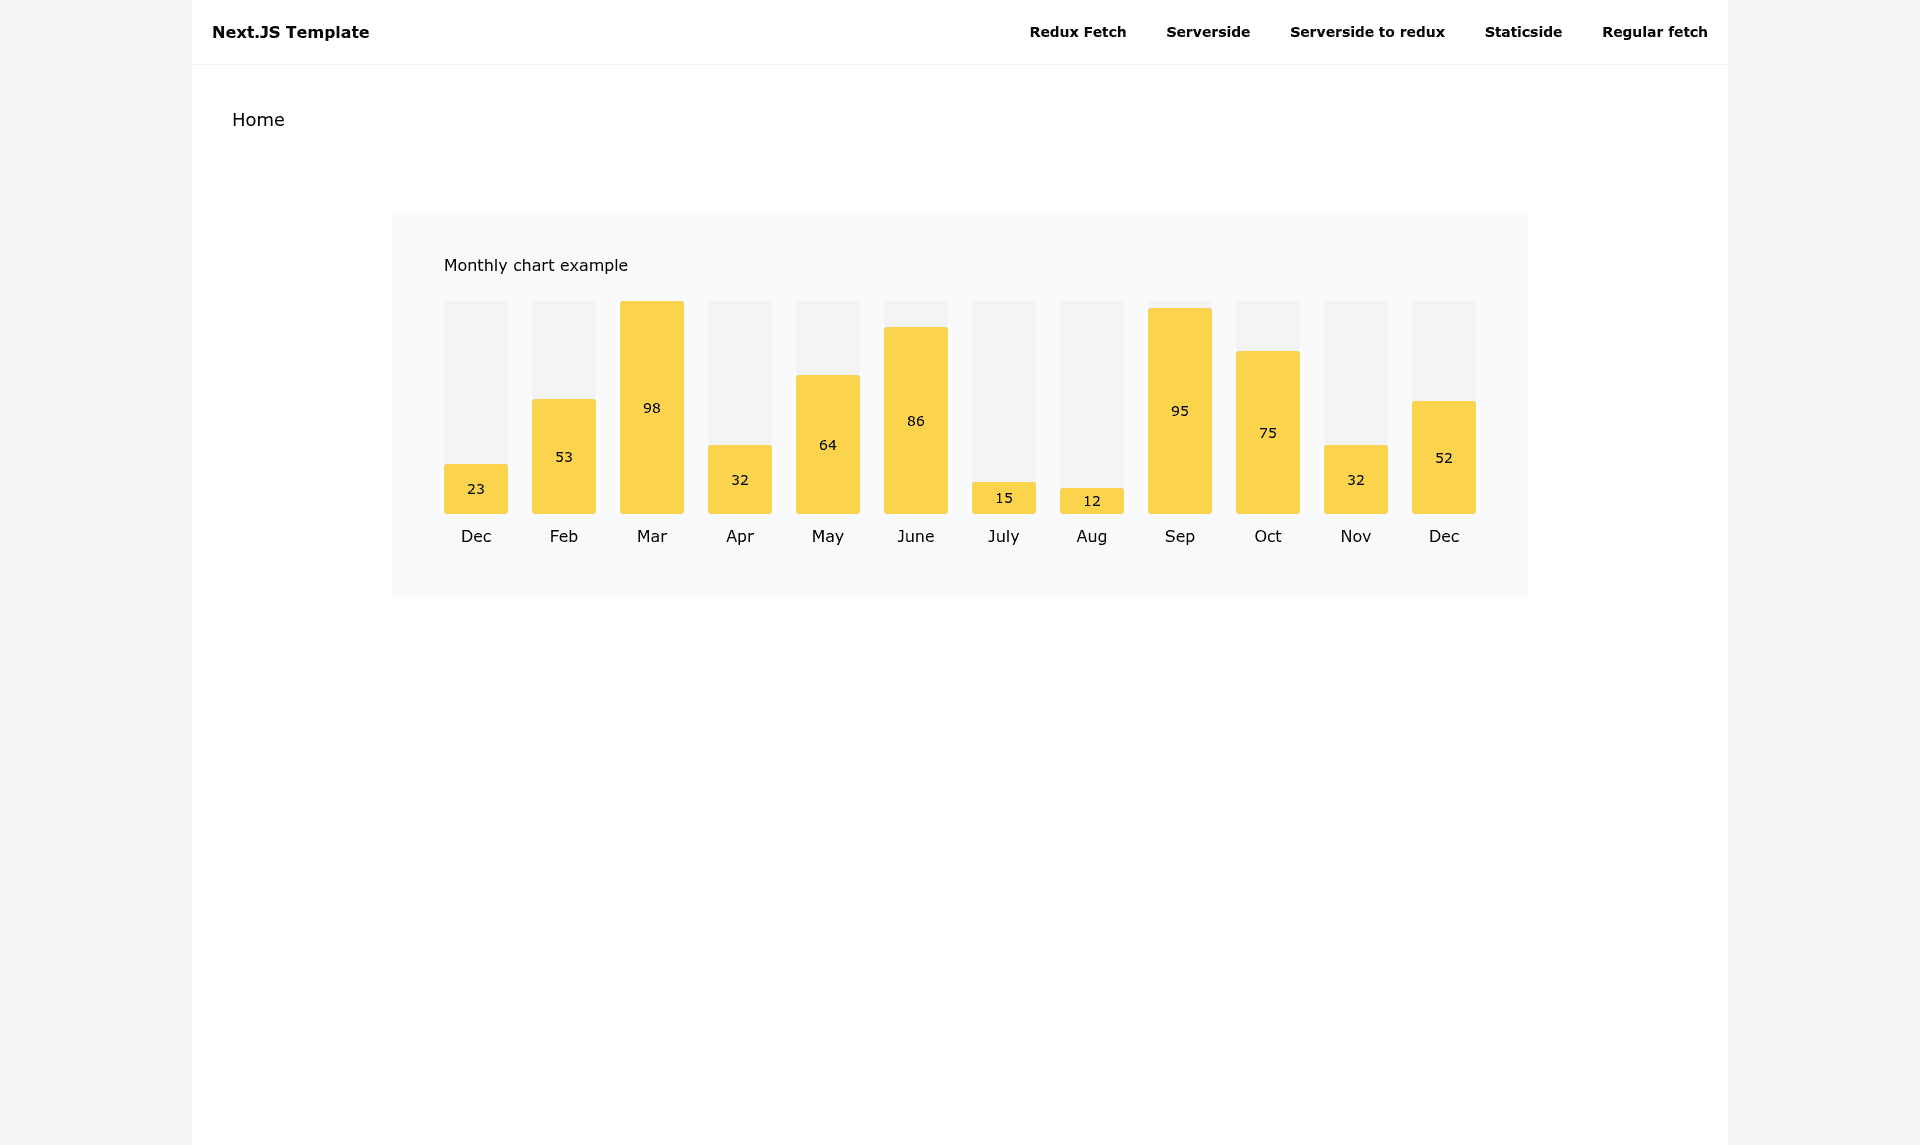

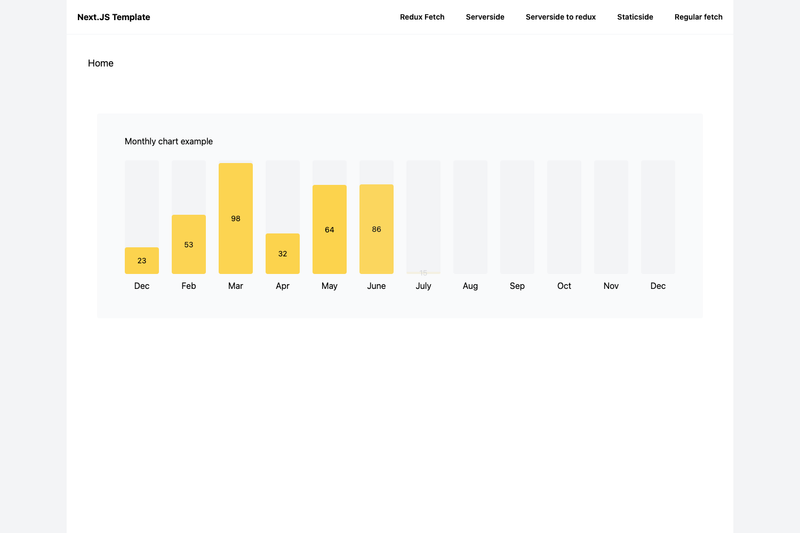
Next.js Tailwind API Chart Example is a free-to-use Boilerplate that demonstrates how to render a chart styled entirely with Tailwind CSS using data fetched from a local Next.js API endpoint.
What is the Next.js Tailwind API Chart Example?
The Next.js Tailwind API Chart Example is an open-source starter project built with Next.js, TypeScript, Tailwind CSS, and SCSS. It takes data from a local Next.js API endpoint and displays it in a chart that is constructed with Tailwind utility classes, avoiding a third-party charting library. The output is a running Next.js application with a functioning chart page, and a live demo is deployed at https://nextjs-typescript-tailwind-api-chart-example.vercel.app/. The repository is authored by Tommy Jepsen on GitHub and is tagged with topics including nextjs-starter, nextjs-boilerplate, and hacktoberfest.
What makes the Next.js Tailwind API Chart Example stand out?
- Custom Tailwind chart — A chart built directly with Tailwind utility classes, so the visualization does not depend on an external charting library.
- Local API data flow — Shows a complete pattern where a Next.js API endpoint supplies data that is fetched and rendered on the page, useful for full-stack Next.js applications.
- TypeScript throughout — The example is written in TypeScript, providing type safety in components, API routes, and data handling.
- SCSS combined with Tailwind — The project includes SCSS alongside Tailwind CSS, demonstrating how the two styling approaches can coexist in one Next.js setup.
- Free to use — The readme explicitly states "Yes! Free to use," so the code can be reused and modified without payment.
- Deployed live preview — The sample is publicly available on Vercel, letting you inspect the chart and data flow in the browser before working with the source.
- Starter-oriented repository — It is labeled as a Next.js starter and boilerplate, making it a compact reference for adding a chart to a new or existing project.
Who should use the Next.js Tailwind API Chart Example?
- Next.js developers — who want a minimal, working example of combining Tailwind, SCSS, TypeScript, and API routes in a single application.
- Developers building dashboard or analytics prototypes — who need a quick chart visualization without pulling in heavy charting dependencies.
- Learners exploring full-stack Next.js — who want to trace how data moves from a local API endpoint into a React component and then into a styled chart.
What can you do with the Next.js Tailwind API Chart Example?
- Build a chart proof of concept: Replace the data returned by the local API endpoint with your own numbers and see them rendered in the Tailwind-based chart.
- Study API-to-UI integration: Follow the fetch call from the component back to the local endpoint to understand how Next.js serves data to its own frontend.
- Start a styled TypeScript project: Clone the repository as a foundation for a Next.js + Tailwind + TypeScript app that already includes SCSS configuration.
Pricing
The template is free to use, as stated in the readme.
FAQ
Is the Next.js Tailwind API Chart Example free?
Yes, the repository readme states "Yes! Free to use." You can copy, modify, and use the code without paying any license fee.
Does this template use a charting library?
No. The chart is custom-built with Tailwind CSS utility classes, so there is no dependency on Chart.js, Recharts, or similar charting libraries.
What technologies are used in this template?
The project uses Next.js as the React framework, TypeScript for type safety, Tailwind CSS for utility styling, and SCSS for additional custom styles.
Where can I see a live demo?
The live demo is hosted on Vercel at https://nextjs-typescript-tailwind-api-chart-example.vercel.app/, where you can view the chart and the data-fetching behavior.