
Template details
Ricive Dashboard
A Next.js dashboard template with Tailwind CSS and Chart.js, built as a frontend developer technical test for Ricive.
About this template
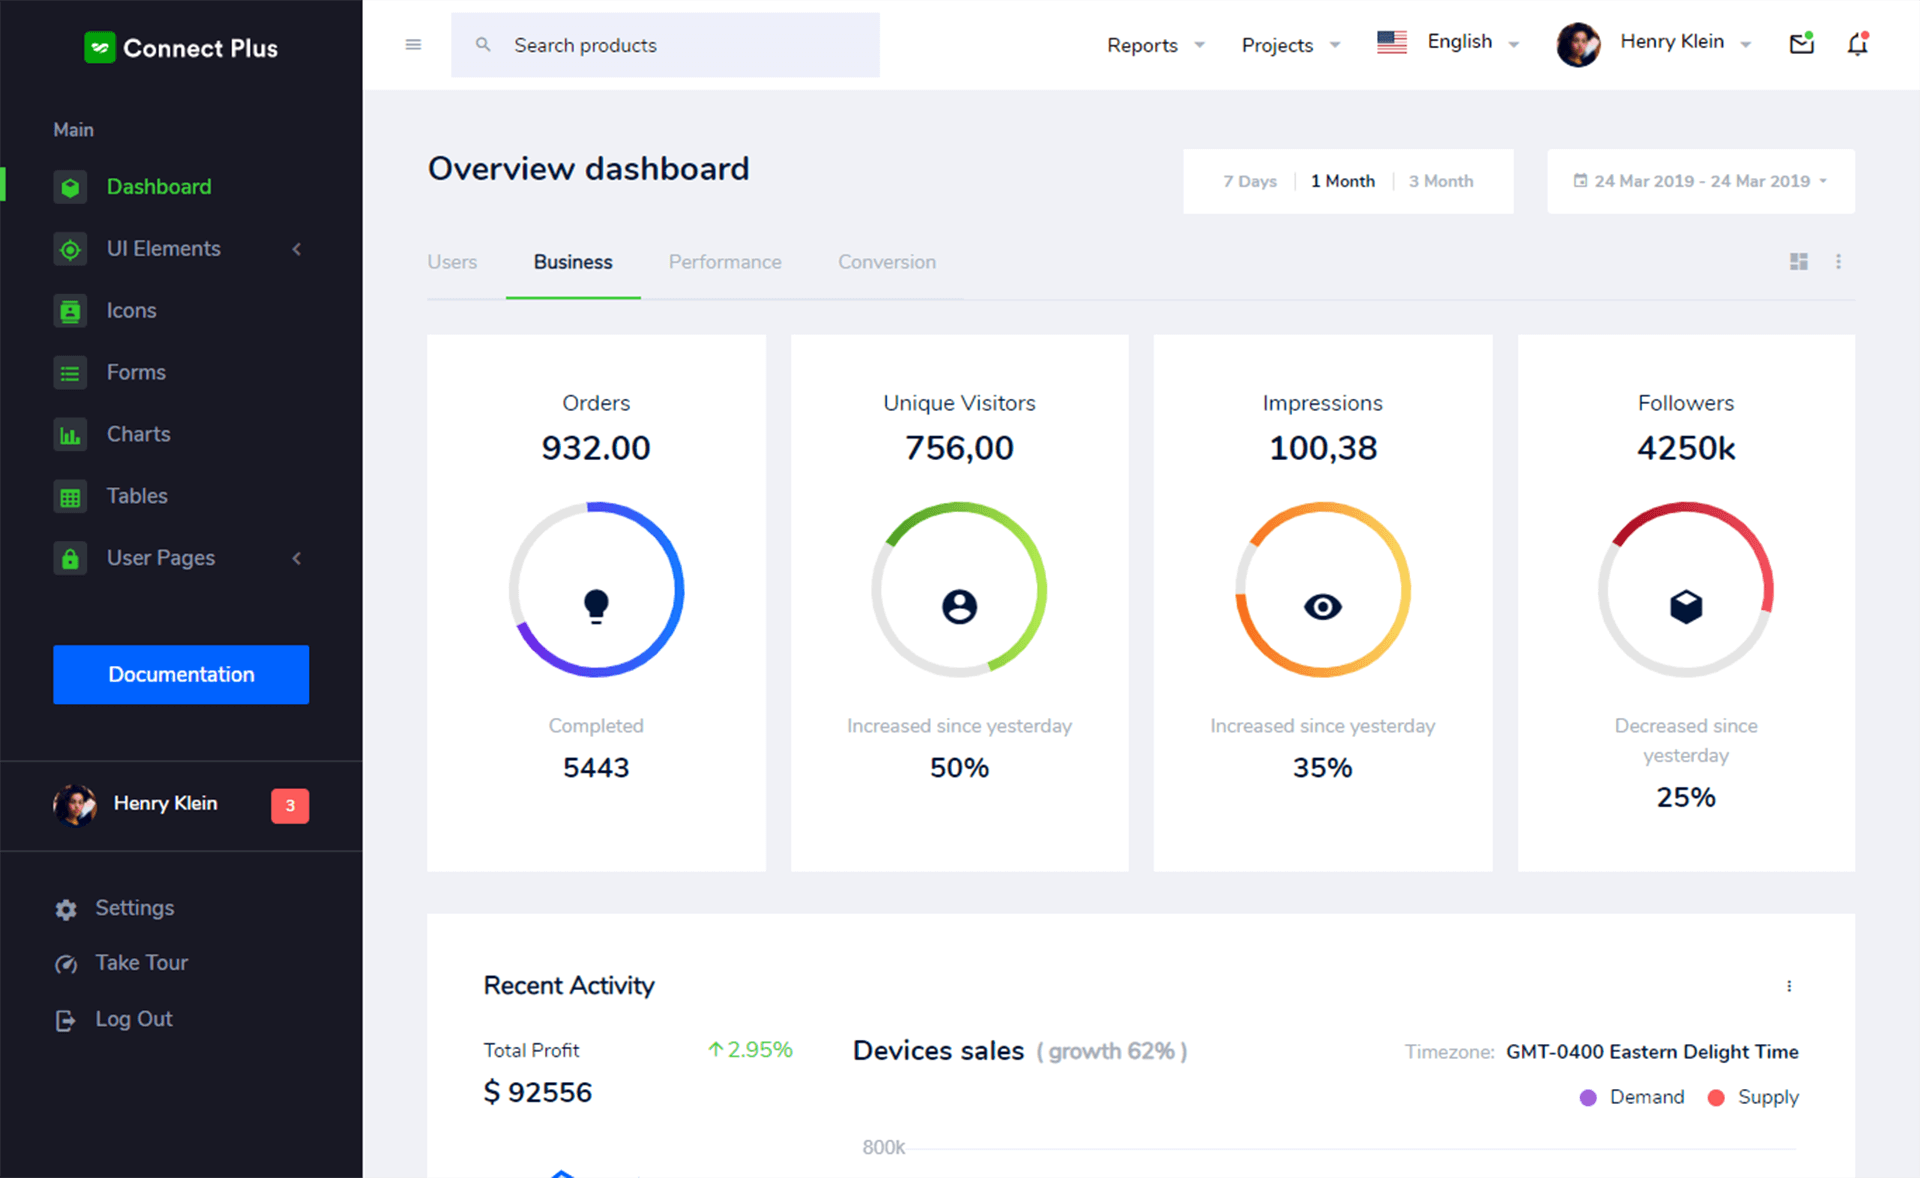
Ricive Dashboard is a Next.js frontend dashboard template created for a technical test at Ricive, demonstrating chart-driven UI with Chart.js and Tailwind CSS.
What is Ricive Dashboard?
Ricive Dashboard is a Next.js application built as a technical test for a Frontend Developer role at Ricive. It renders a dashboard interface with data visualization powered by Chart.js, styled entirely with Tailwind CSS. The project exists on GitHub as cindyeme/ricive-dashboard, and a live demo is hosted on Vercel at https://cynthia-ricive-dashboard.vercel.app/. It runs locally on port 3000 using the Yarn package manager.
Key Features
- Next.js framework — Built on the React-based Next.js framework, providing file-based routing, server-side rendering, and a production build system.
- Tailwind CSS styling — Styling is done with Tailwind CSS utility classes, allowing rapid UI customization directly in JSX.
- Chart.js integration — Includes Chart.js, a JavaScript library for creating responsive charts, suitable for analytics dashboards.
- Yarn dependency management — Uses Yarn as the package manager for installation and running development scripts.
- Live demo on Vercel — A deployed preview is available at https://cynthia-ricive-dashboard.vercel.app/, letting users test the dashboard without local setup.
- Simple setup commands — The README documents a four-step workflow: clone the repo, run
yarn, runyarn dev, and open http://localhost:3000.
Who is it for?
- Frontend developer candidates — Can use this as a reference solution for a dashboard coding challenge, showing skills in Next.js, Tailwind, and Chart.js.
- Hiring teams and interviewers — Can review the codebase structure and deployment to assess a candidate's practical frontend abilities.
- Developers bootstrapping dashboards — Can clone the repository and adapt the existing chart components and layout to build custom admin panels.
What can you do with Ricive Dashboard?
- Examine Next.js project structure: Inspect the pages and components to understand how a minimal update dashboard is organized.
- Add new chart types: Extend the Chart.js integration to include bar, line, or pie charts for different data sets.
- Modify the visual theme: Use Tailwind utility classes to change colors, spacing, and typography across the dashboard.
How does Ricive Dashboard work?
The repository's README outlines the standard Next.js workflow: clone the GitHub repository, install dependencies with yarn, start the development server with yarn dev, and open http://localhost:3000. Because Next.js supports hot reloading, edits to the source files appear immediately in the browser during development.