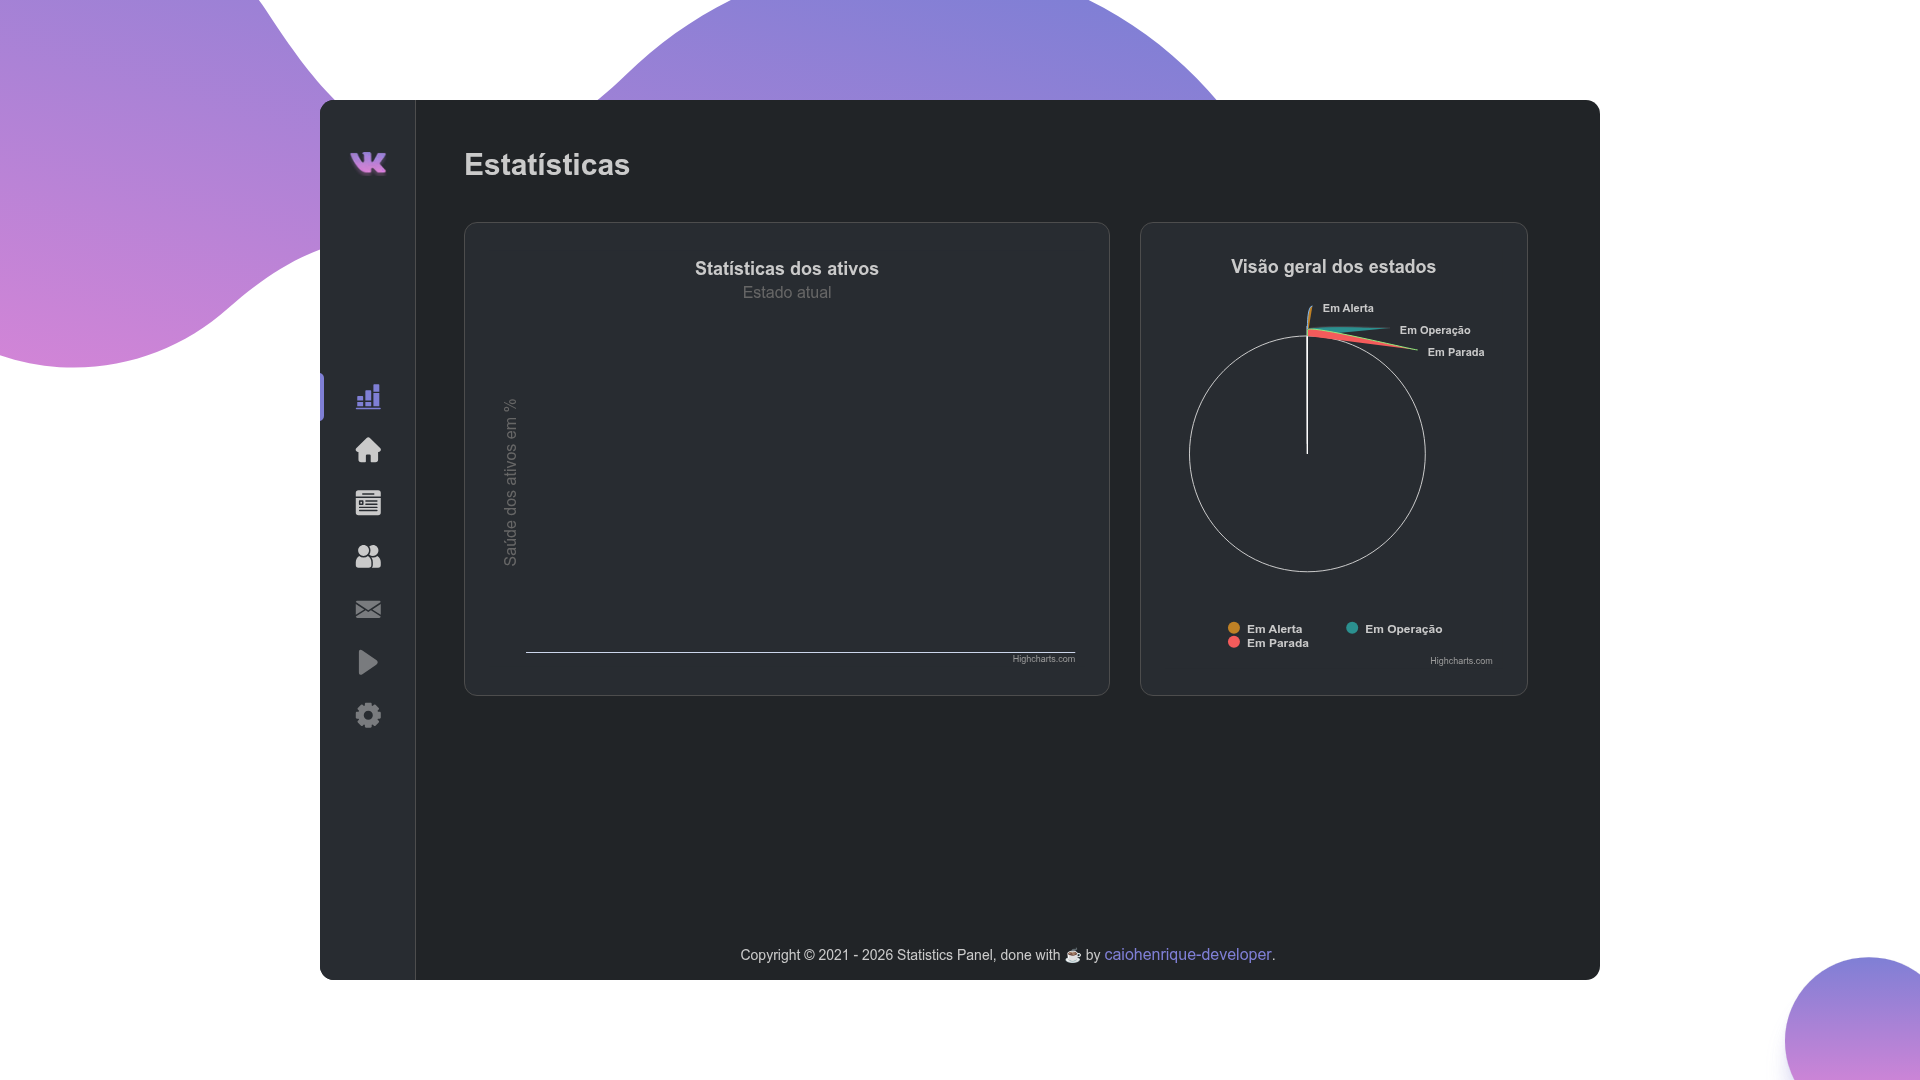

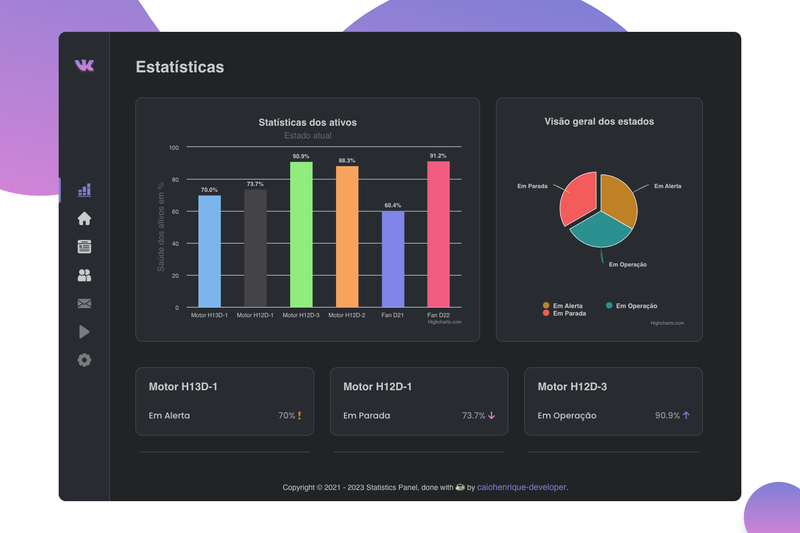
Statistics Panel is a dashboard template built with Next.js for creating industry statistics panels, featuring pre-built Users, Assets, and Companies/Units pages with Highcharts-based data visualization.
What is Statistics Panel?
Statistics Panel is an open-source industry statistics dashboard template built on Next.js and React. It takes API data via Axios and renders asset statistics as interactive charts using Highcharts and highcharts-react-official. The project runs on Vercel with a live demo at statistics-panel.vercel.app, and is authored by Caio Henrique under the MIT license.
Key Features
Statistics Panel comes with several notable features that make it ready to use.
- Highcharts visualizations — Uses Highcharts and highcharts-react-official to display asset statistics as interactive charts.
- Responsive pages — Includes responsive Users, Assets, and Companies/Units pages built with react-responsive.
- Next.js framework — Built on Next.js with React, supporting server-side rendering and static site generation.
- Styled-components — Styling handled by styled-components and Polished, with Sass and SVGR available in the toolchain.
- Axios HTTP client — Fetches API data through Axios.
- Date utilities — Uses date-fns and Moment for date parsing and formatting.
- TypeScript — Written in TypeScript (dev dependency) for type safety.
- Vercel deployment — One-click deploy via Vercel; the production site is live at statistics-panel.vercel.app.
- Developer tooling — Pre-configured with Husky, Commitlint, Commitizen, ESLint, Prettier, and EditorConfig.
Who is it for?
Statistics Panel is for developers who need a ready-made dashboard to display industry metrics and asset statistics. It suits data analysts who want to visualize API data with charts, and frontend developers looking for a Next.js + Highcharts boilerplate with responsive pages. It also serves teams that need a clean, deployable panel for monitoring users, assets, and companies.
What can you do with Statistics Panel?
Statistics Panel supports the following practical scenarios.
- Industry analysts: Visualize asset statistics with interactive Highcharts graphics to track performance and trends.
- Developers: Use the template as a starting point for custom dashboards, connecting your own API endpoints via Axios.
- Operations managers: Browse the Companies and Units pages for a quick overview of business units.
How does Statistics Panel work?
Clone the repository from GitHub, install dependencies with Yarn or npm, and run the development server with yarn dev. The project can also be deployed to Vercel directly using the Deploy button on the README.
FAQ
Here are answers to common questions about Statistics Panel.
Is Statistics Panel free?
Yes, the project is open-source and released under the MIT license, allowing free use, modification, and distribution.
What tech stack does Statistics Panel use?
The core stack is Next.js, React, TypeScript, and styled-components, with Highcharts for charts, Axios for HTTP requests, and date-fns/Moment for date handling.
Can I deploy Statistics Panel to Vercel?
Yes, the repository includes a Deploy to Vercel button and the live demo runs at statistics-panel.vercel.app.
What pages are included in Statistics Panel?
The template includes responsive pages for Users, Assets, and Companies/Units, all designed to display statistics in a graphical panel.
What are the prerequisites to run Statistics Panel locally?
You need Git, Node.js v10.16 or higher, and Yarn v1.13 or higher installed on your machine.