
Covid19 Tracker is an open-source Next.js dashboard that shows real-time coronavirus distribution worldwide through an interactive map and per-country, per-continent analysis.
What is Covid19 Tracker?
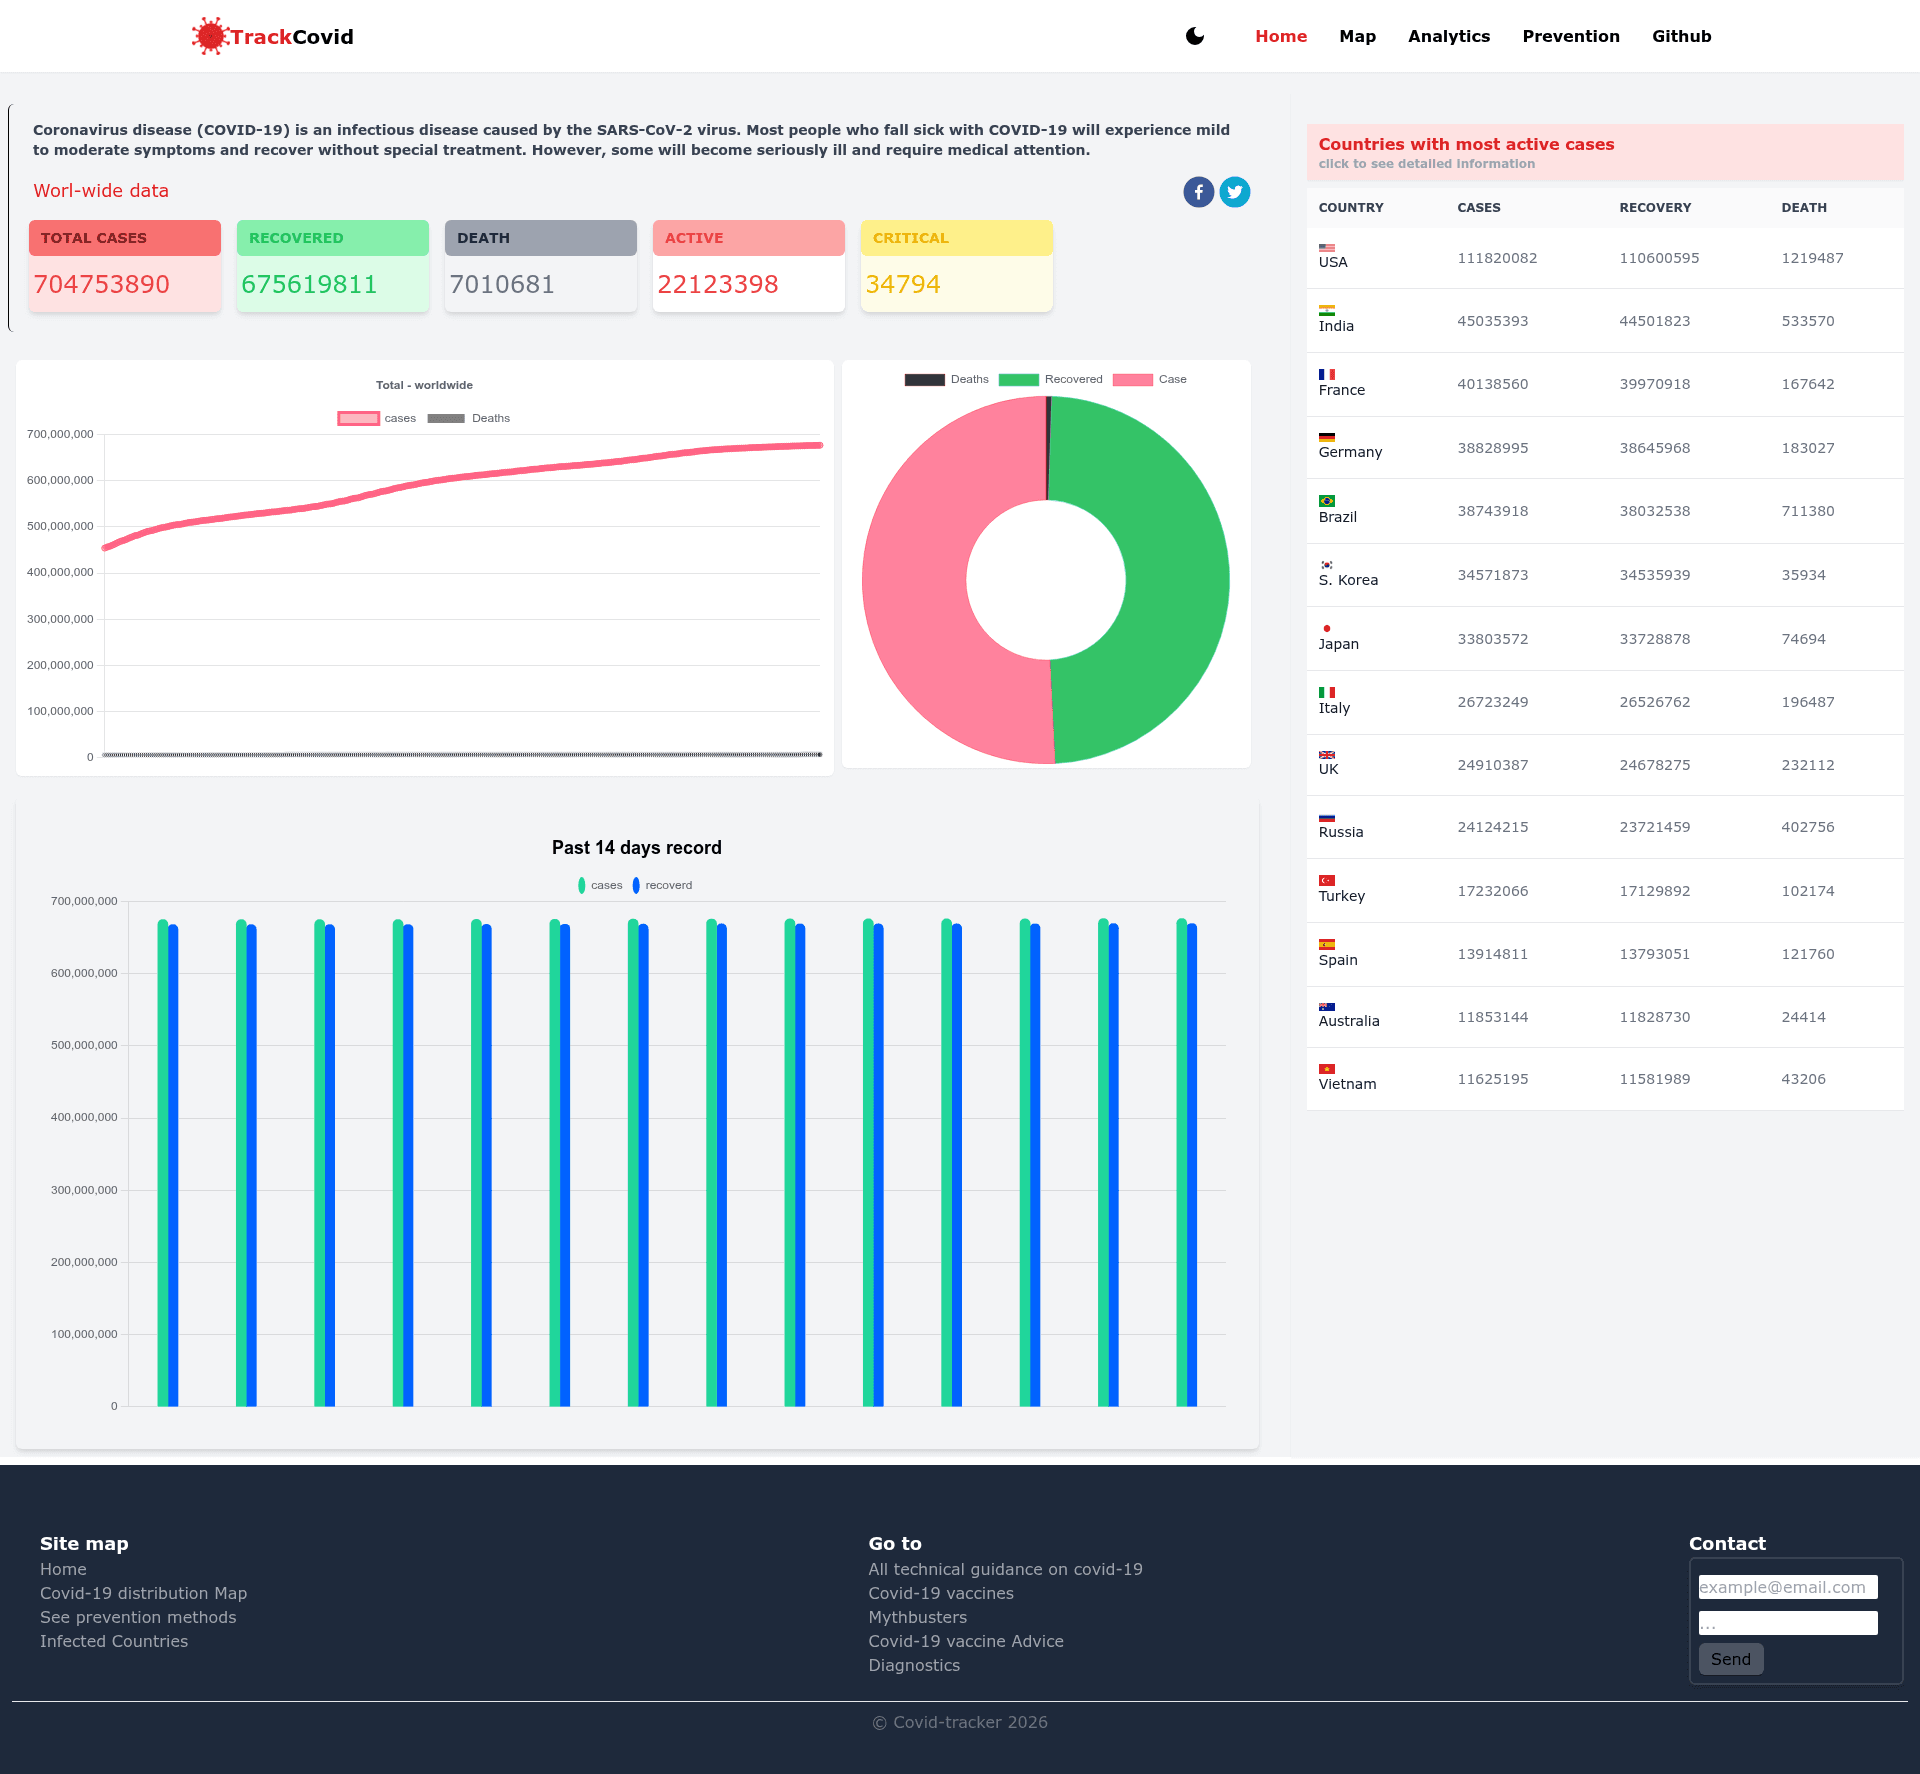
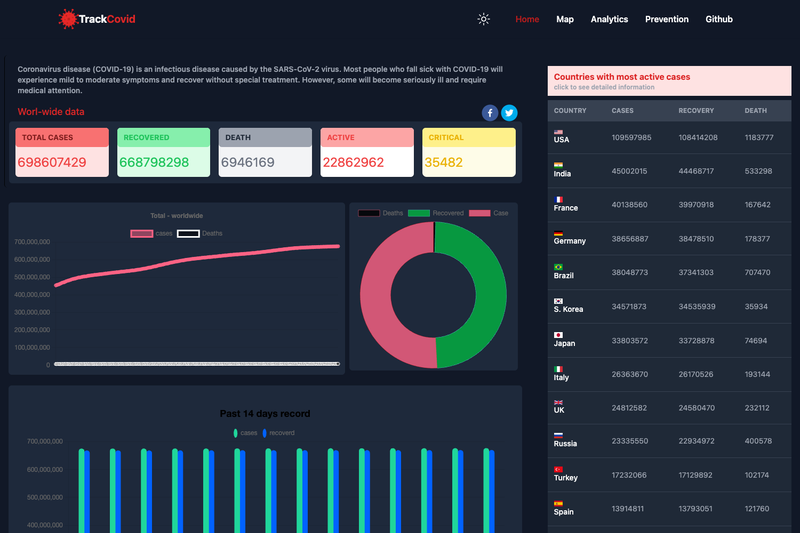
Covid19 Tracker (viewable at trackcovid19.vercel.app) is a web application built with Next.js that tracks the latest coronavirus distribution around the world. It consumes a Covid-19 data API and outputs an interactive distribution map, country-specific statistics, continent-specific statistics, a most-affected-countries list, and global trends for the past 365 days. The project was bootstrapped with create-next-app, is written in TypeScript, and styled with Tailwind CSS.
Key Features
- Interactive distribution map — Renders Covid-19 case data on a map using react-leaflet.
- Country and continent analysis — Users can drill down to see statistics for a specific country or whole continent.
- Most affected countries list — Ranks countries by Covid-19 impact on a leaderboard-style list.
- 365-day worldwide record — Displays a historical curve of global cases over the past year.
- Current worldwide data — Shows the latest global total cases on the dashboard.
- Dark mode — The UI includes a dark theme, as noted in the repository's dark-mode topic.
- SSR and responsive design — Next.js server-side rendering is enabled, and the layout adapts to mobile and desktop.
Who is it for?
- Data journalists — need country- and continent-level stats to cite in articles about the pandemic.
- Public health teams — can monitor the 365-day trend to identify new waves or improvements.
- Developers — can use this as a starter template for building a chart- and map-heavy dashboard with Next.js and Tailwind.
- General visitors — can browse the live app to check current global Covid numbers.
Use cases
- Journalists covering Covid-19: pull the most-affected-countries list and continent analysis for a story.
- Health communicators: embed the map or share links to country-specific pages during briefings.
- Developers learning Next.js: study how SSR, Redux, and react-leaflet are integrated in a real project.
How does Covid19 Tracker work?
The project is a standard create-next-app setup. To run it locally, clone the repository, run npm install, then npm run dev, and open http://localhost:3000. The app fetches Covid-19 data from an API on the server (Next.js SSR) and passes it to the front-end components for rendering.
FAQ
Is Covid19 Tracker free?
Yes, the source code is publicly available on GitHub with no licensing restrictions mentioned, and the app can be self-hosted for free.
What data does it show?
It shows current worldwide Covid-19 cases, a distribution map, country- and continent-specific statistics, a ranking of the most affected countries, and a record of the past 365 days.
Can I use this for my own project?
Yes, because it is open source. You can fork the repository, modify the data source or UI, and deploy the resulting Next.js app to any Node.js host.
Does it have dark mode?
Yes, the dashboard supports dark mode, as indicated by the repository's dark-mode topic.