Newsletter
Join the Community
Subscribe to our newsletter for the latest news and updates

A simple dashboard to view monthly analytics of my bank transactions.
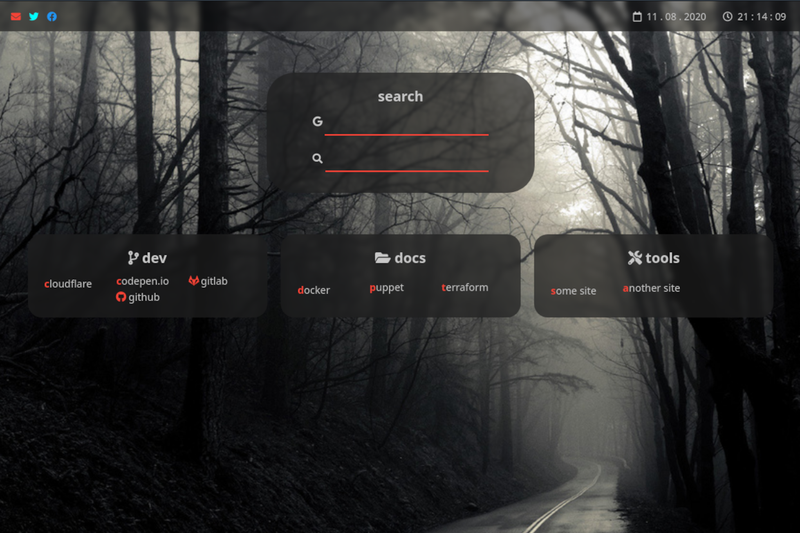
A responsive Hugo start-page theme for managing bookmarks, search engines, and quick links.
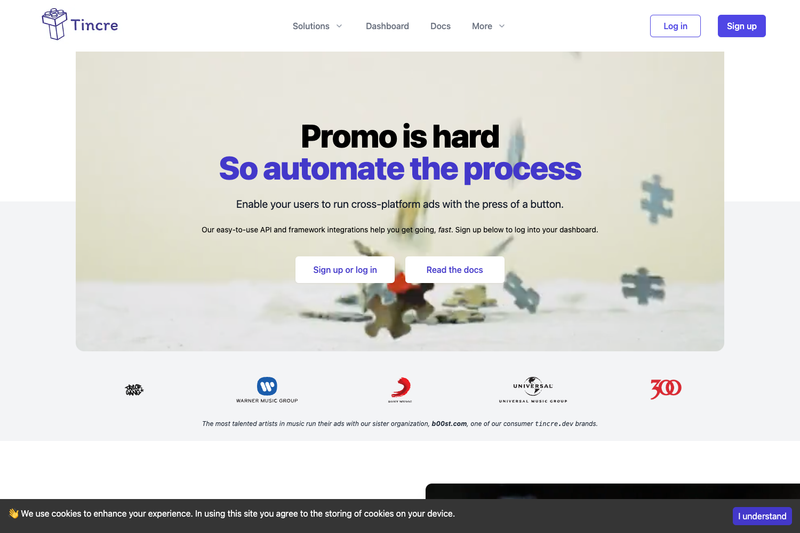
A React/Next.js dashboard component for visualizing and managing Tincre Promo API campaign data.
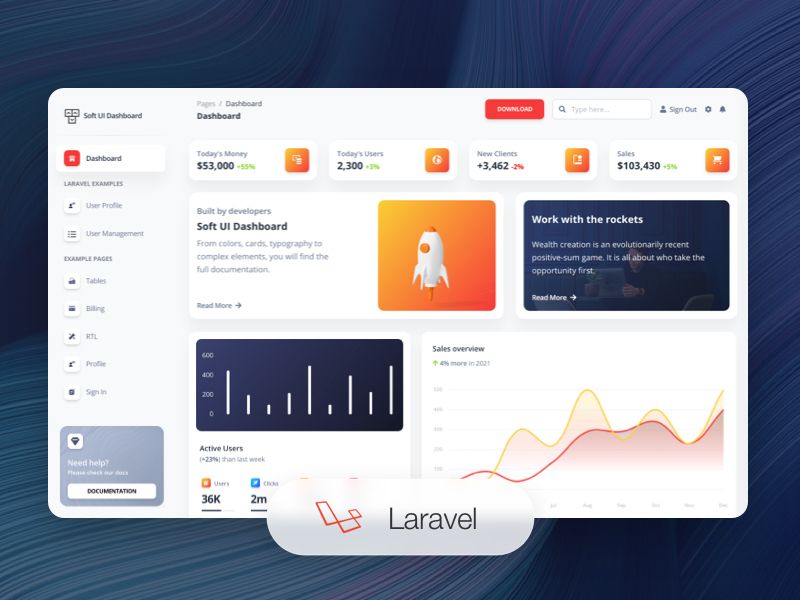
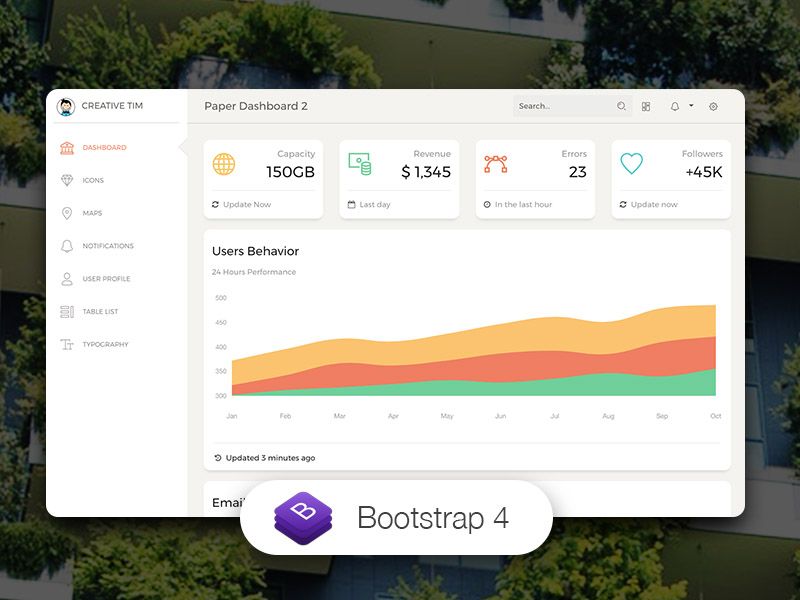
Free Laravel admin dashboard template with Soft UI design, Bootstrap 5, auth, and 70 UI components.
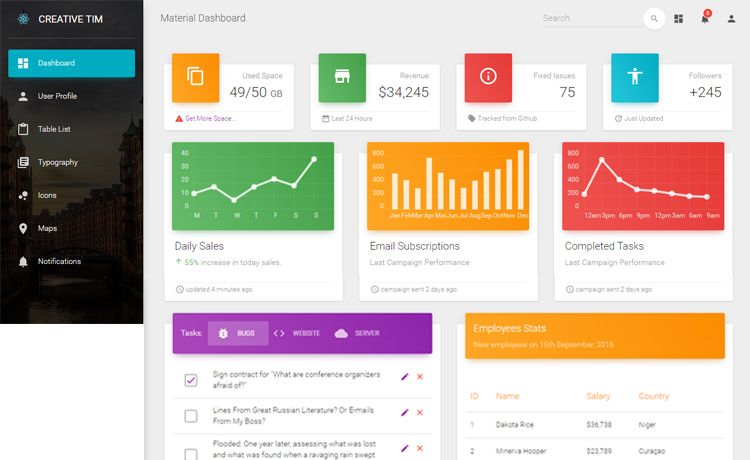
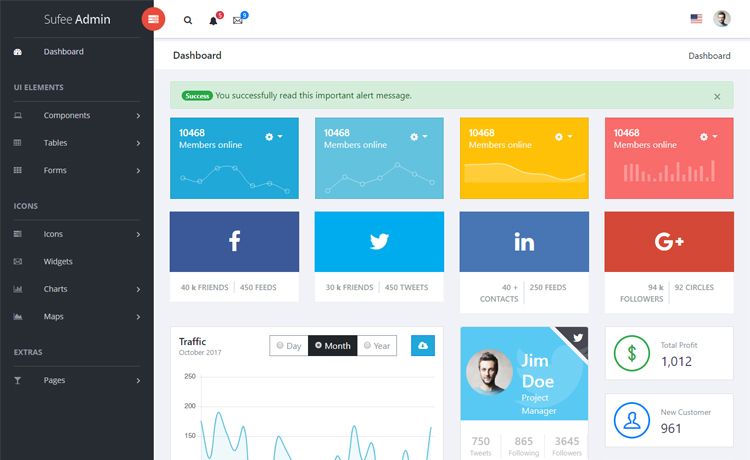
Free React admin dashboard template with Material Design, Bootstrap, ready-made components, and responsive layout.
Bank Transactions Web UI is a dashboard template built with Next.js and MongoDB for viewing monthly analytics of bank transactions. It reads transaction data from a MongoDB collection and renders it in a responsive web interface with charts, month navigation, and dark or light theme.
Bank Transactions Web UI is a web-based dashboard that ingests parsed bank transaction records stored in MongoDB and displays them as monthly analytics. It is built on the Next.js React framework and uses ApexCharts.js for data visualization. The project is maintained by Stavros Melidoniotis on GitHub and pairs with a companion parser repository that converts TSV exports into MongoDB documents.
Bank Transactions Web UI is aimed at developers who want a ready-made personal finance dashboard they can deploy with their own data pipeline. It is also useful for anyone comfortable exporting their bank statements to TSV and running a parser script. Additionally, the project serves as a learning example for combining Next.js, MongoDB, and charting libraries in a real application.
Each month's transactions are exported from a bank into a TSV file. The companion bank-transactions-parser script processes that TSV, extracts the useful fields, and uploads them into a MongoDB database. The Next.js application then queries that MongoDB collection and renders the data in the UI, allowing login, month navigation, and chart display.
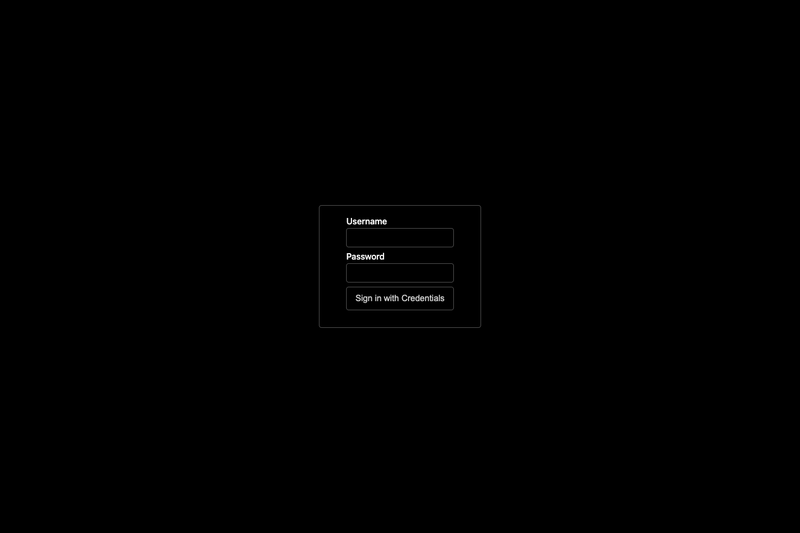
The demo is hosted at bank-transactions.melidon.dev. Log in with username 'demo' and password 'super-secret-passw0rd'. The demo data is randomly generated, so some numbers may not look realistic.
The system uses TSV (tab-separated values) files for monthly transaction exports. The parser companion extracts information from these files and stores it in MongoDB.
Yes, multiple users are supported, and each user's data is separated by the authentication system.
The charts are rendered with ApexCharts.js, a JavaScript charting library integrated into the Next.js front-end.
The repository is publicly available on GitHub under the account stavros-melidoniotis, and the companion parser is linked as a separate public repository.