
British Petitions Dashboard is an open-source single-page application that visualizes UK Parliament petition data from petition.parliament.uk in a digestible dashboard format.
What is British Petitions Dashboard?
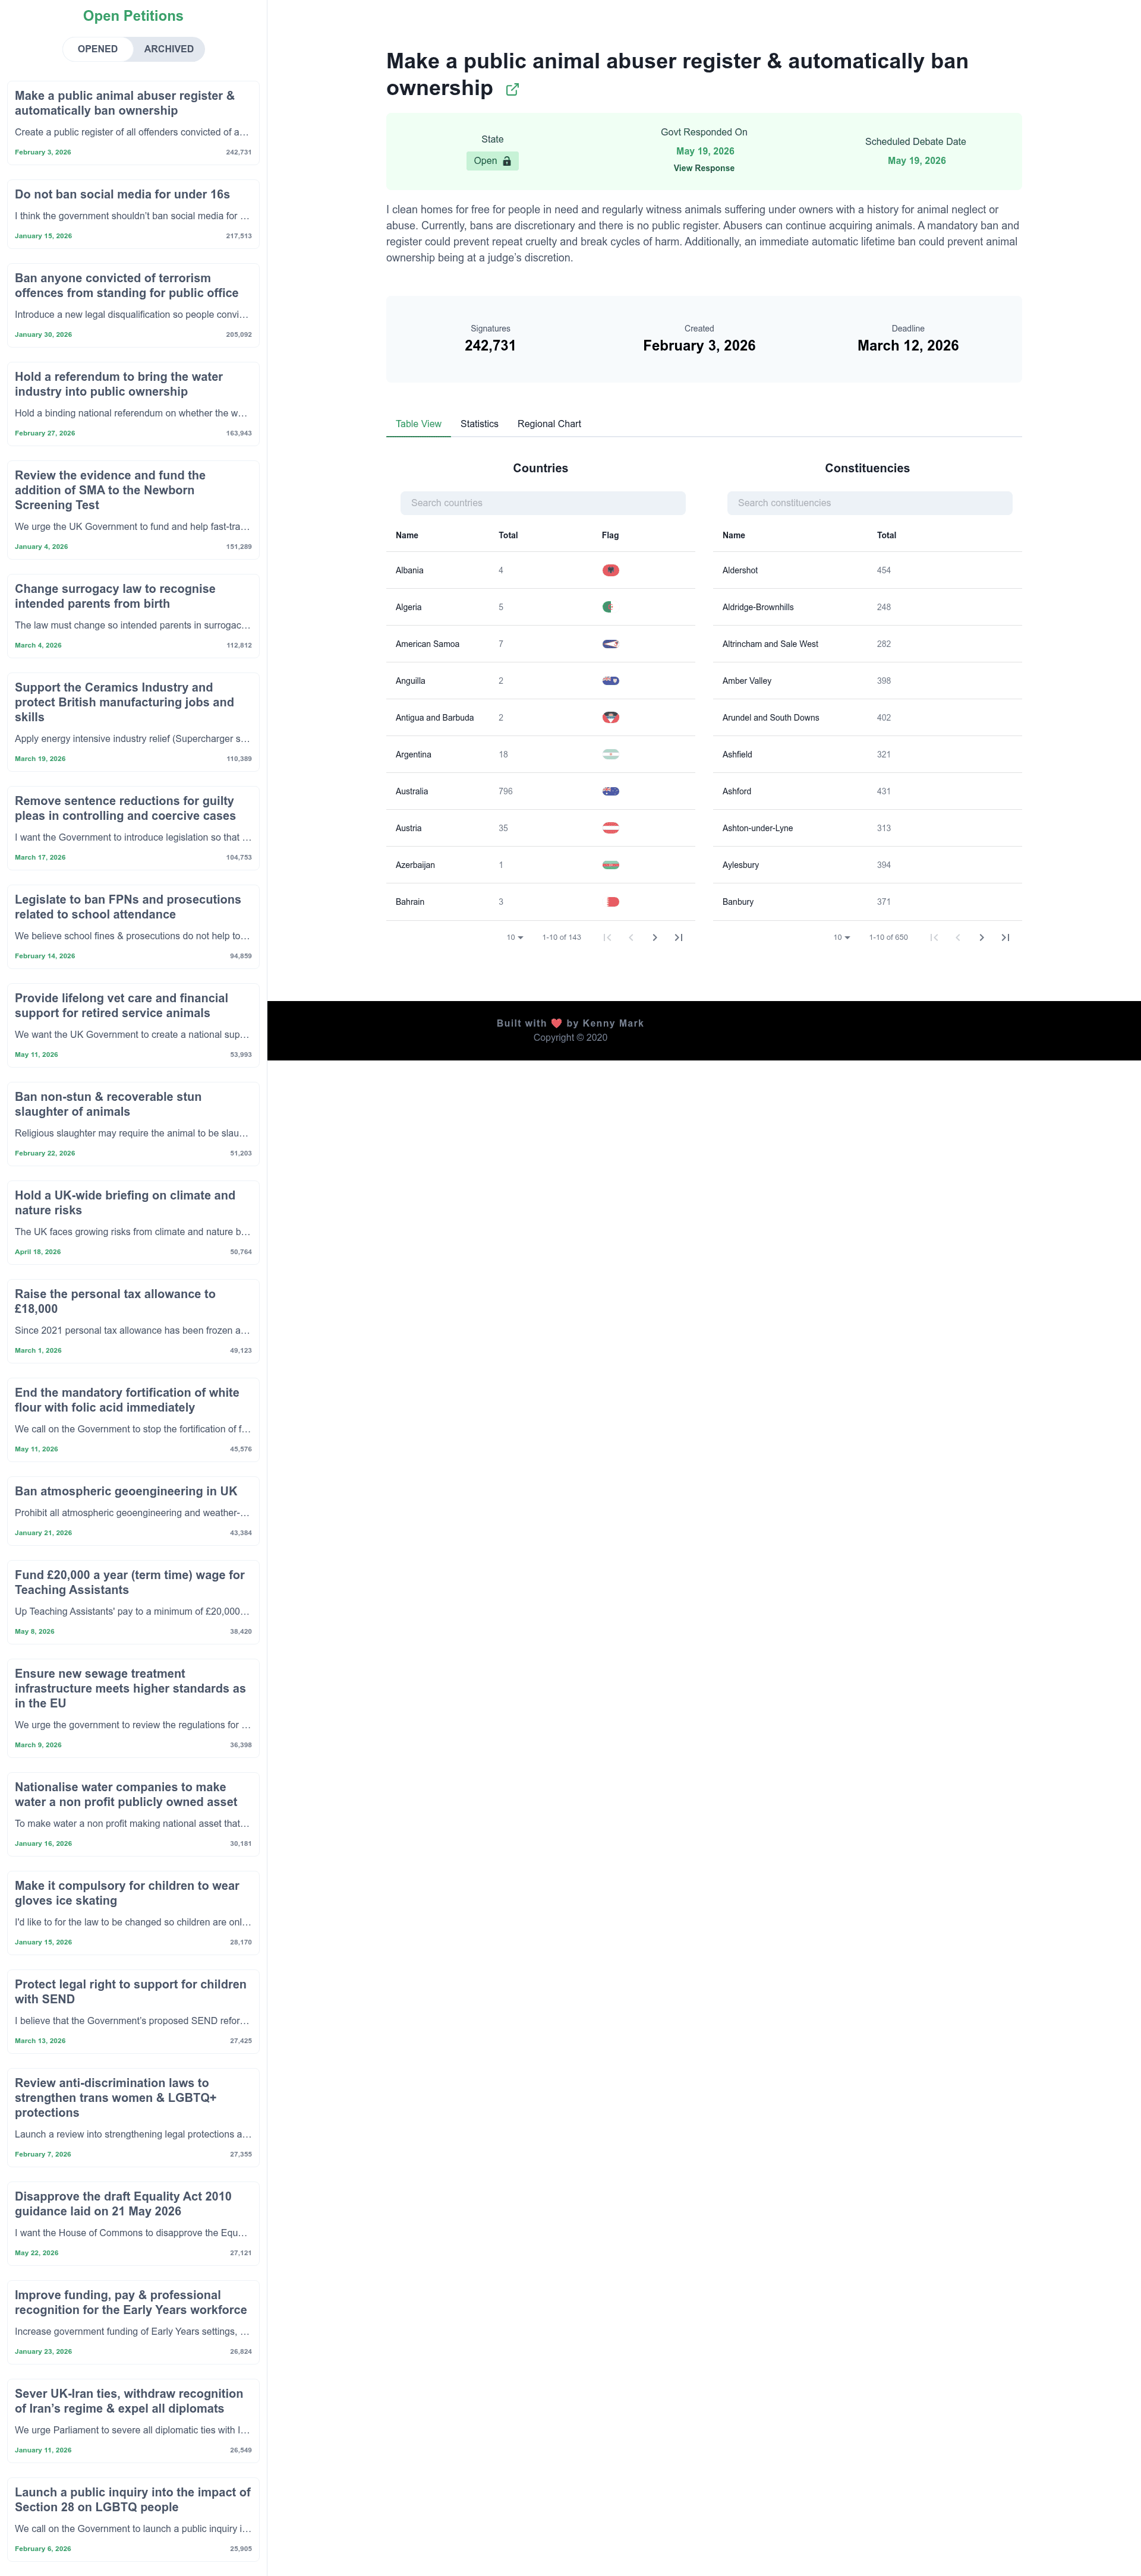
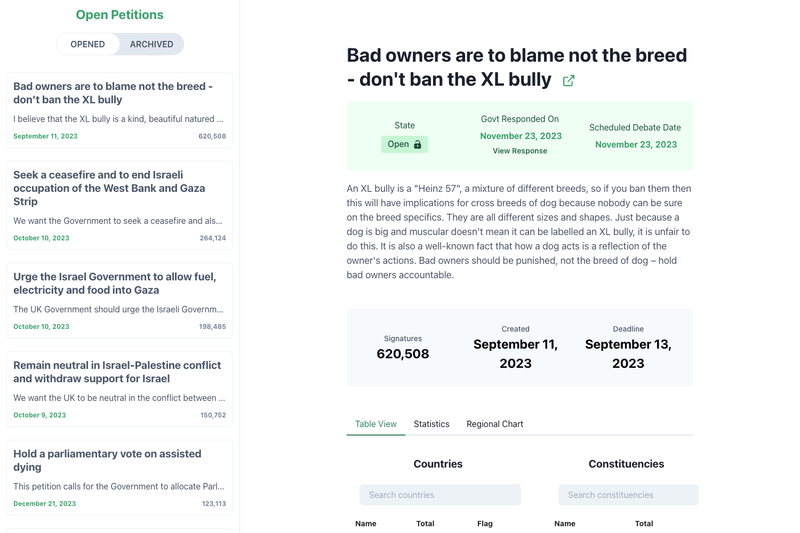
British Petitions Dashboard is a single-page application built with Next.js, React, TypeScript, and Chakra UI that re-presents UK Parliament petition data in a more accessible form than the official petition.parliament.uk website. The application takes the basic information shown by the official site and adds a breakdown of the data via table, statistics, and chart views. It is developed by Kenny Mark and hosted on GitHub under the repository kennymark/british-petitions-dashboard. The README describes the goal as 'better present data from petitions of the British parliament.'
Key Features
- Responsive, mobile-friendly UI — The layout adapts to phone and tablet screens, making petition data readable on the go.
- Table View — A sortable tabular display of petitions, captured in the
screenshots/table-view.pngscreenshot. - Stats View — A statistical breakdown of petition support, shown in
screenshots/stat-view.png. - Chart View — A visual representation of the data using the recharts library, shown in
screenshots/chart-view.png. - Offline support — The SPA includes offline capability, letting users access previously loaded data without a network connection.
- Next.js with TypeScript — Built on the Next.js React framework with TypeScript typing; styling is handled by Chakra UI.
- Recharts integration — Charts are rendered with recharts, a React charting library.
- Map View (planned) — A map view is listed as a feature but also appears in the to-do list, indicating it is not yet implemented.
Who is it for?
- Data journalists and researchers who want a clearer, more graphical summary of UK petition signatures than the official parliament list provides.
- Front-end developers seeking a practical example of a Next.js + TypeScript + Chakra UI dashboard that consumes external data.
- Civically engaged citizens who want to quickly see which petitions have the most support and how that support breaks down.
What can you do with it?
- Monitor petition growth: View signature counts through the stats and chart views to understand how petitions gain support.
- Browse and compare petitions: Use the table view to scan open petitions and compare their support levels.
- Work offline: The offline support means you can review previously loaded petition data when you lose connectivity.