Newsletter
Join the Community
Subscribe to our newsletter for the latest news and updates

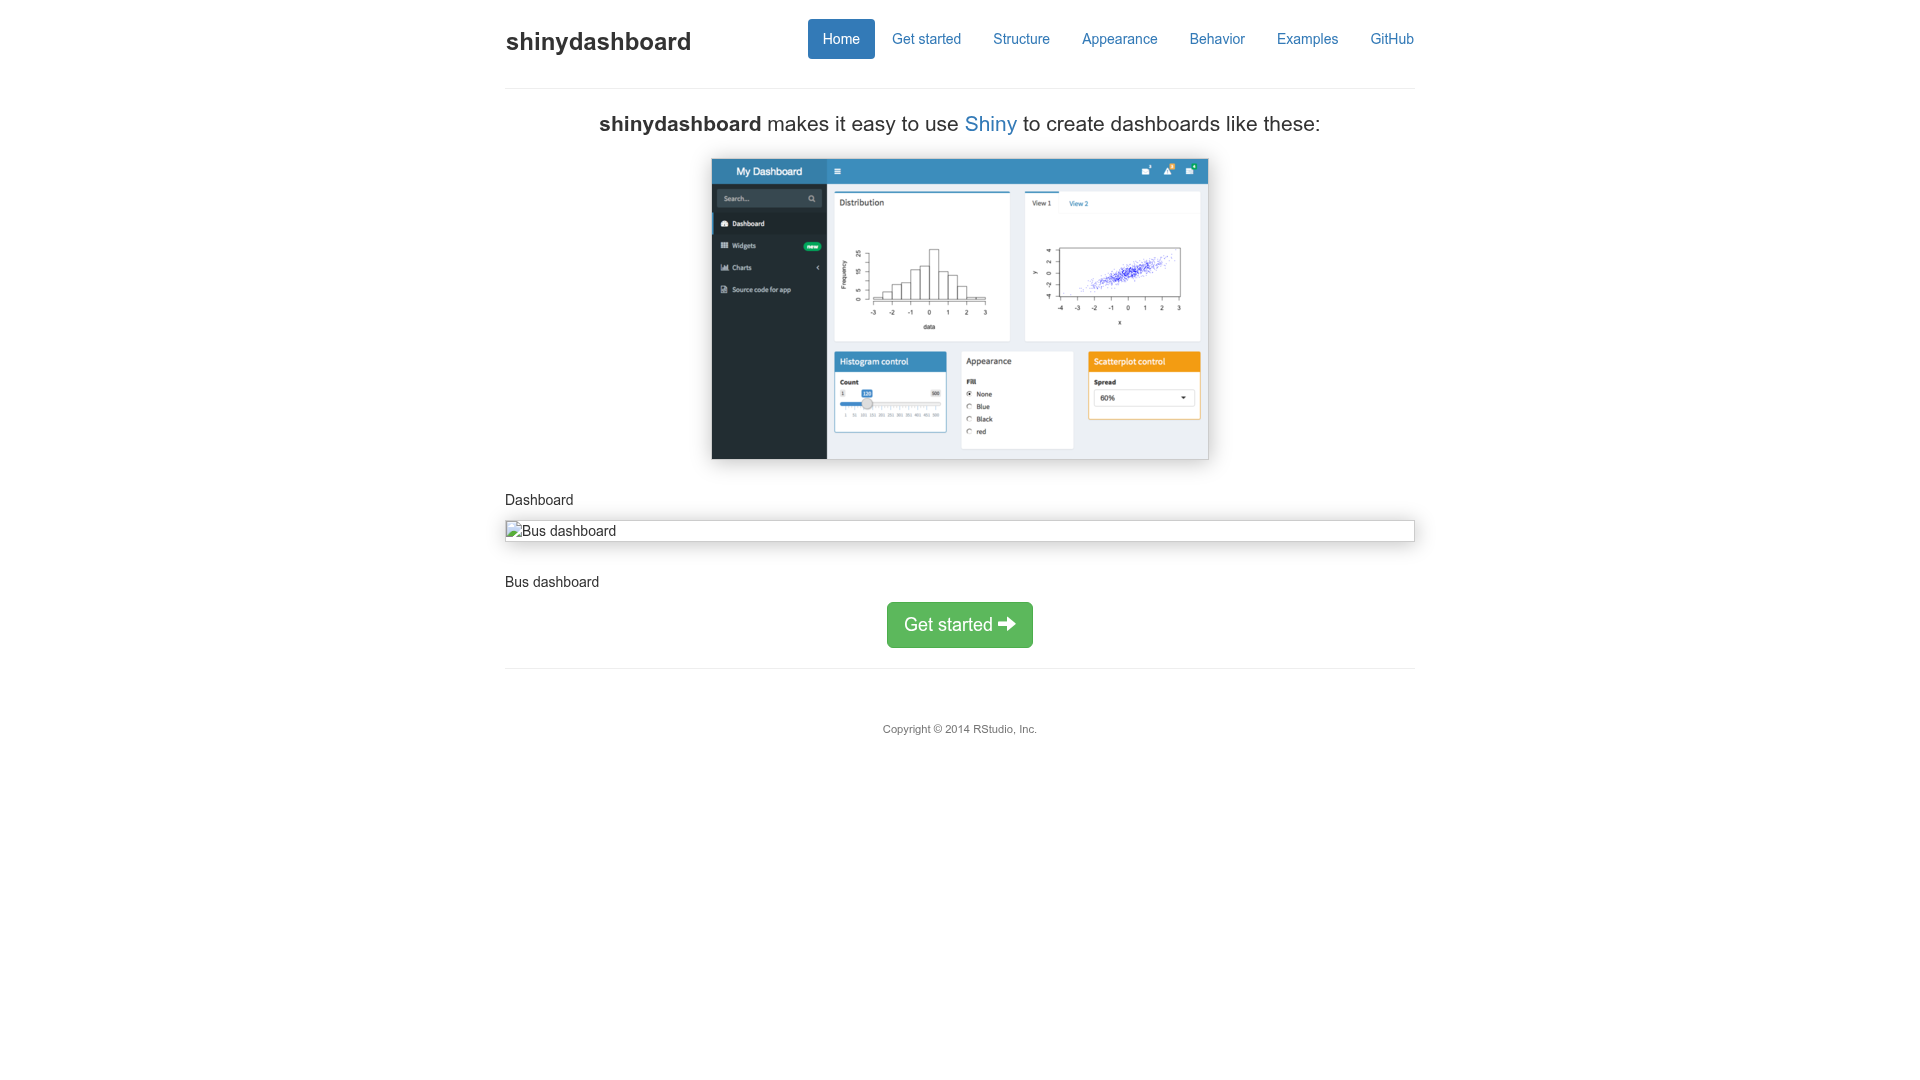
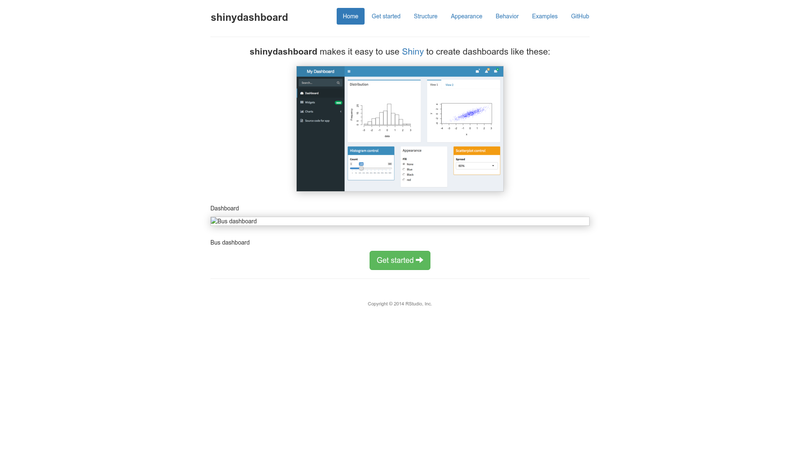
R package by RStudio that provides a dashboarding framework for building Shiny web apps with an admin-style layout.
Free dark-mode React admin dashboard template with React-Bootstrap, Chart.js, and Material Design Icons.
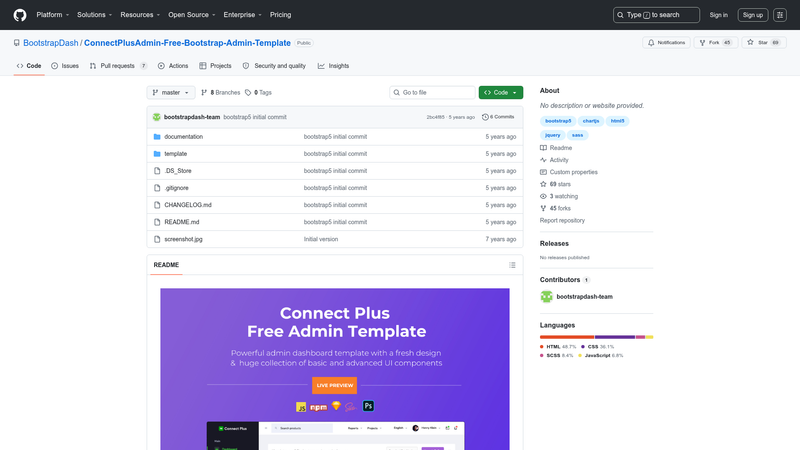
Free responsive Bootstrap 5 admin template with a colorful design for building dashboards, e-commerce systems, project management tools, CMS, and CRM.
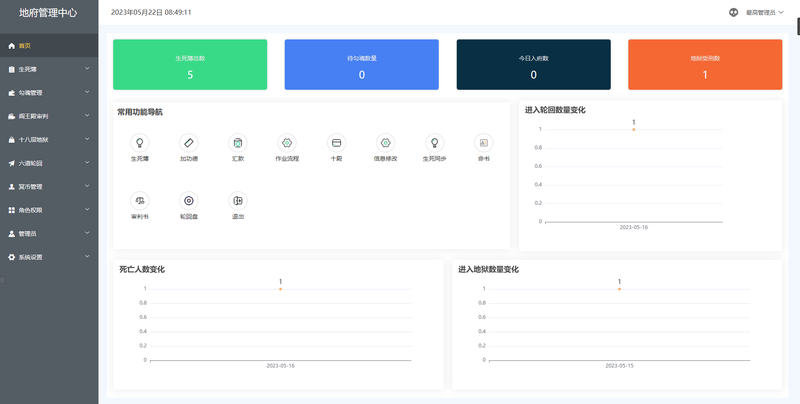
Open-source netherworld management system: Vue + Element UI admin dashboard, Node + MySQL + Express API, and user frontend with role-based permissions.
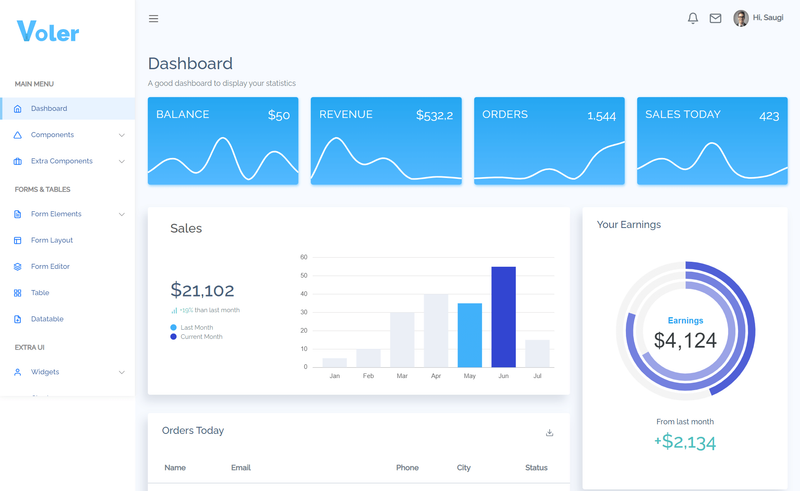
Free multi-page Bootstrap 5 admin dashboard template with 20+ UI elements, Chart.js charts, datatables, and auth pages.
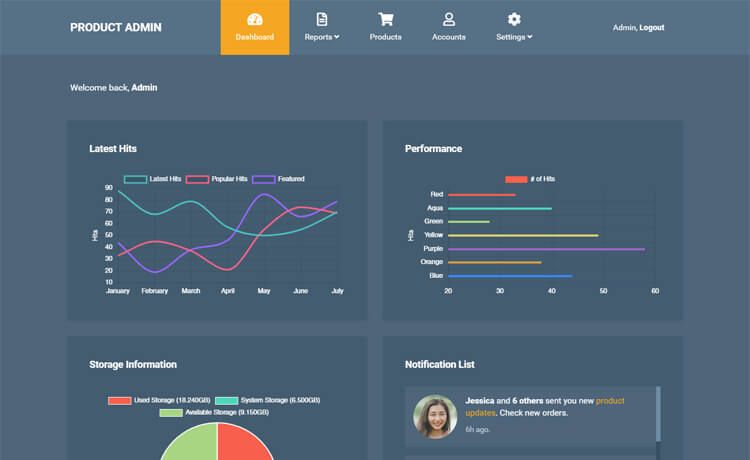
Free Bootstrap 4 admin dashboard template for e-commerce product management, with charts, data tables, and login pages.
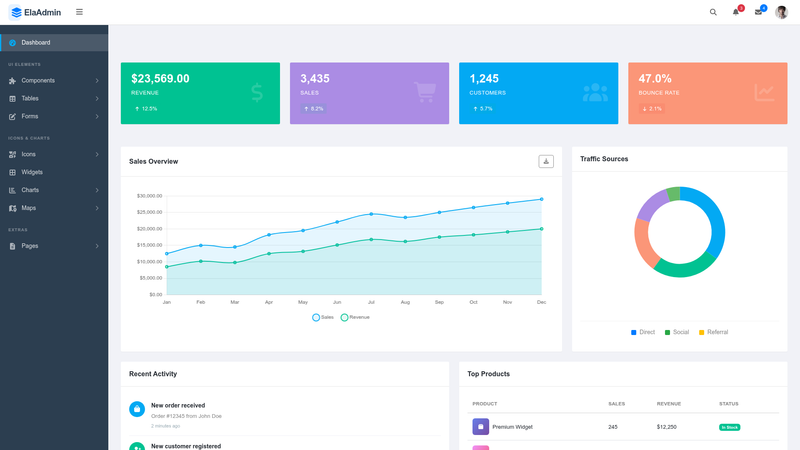
A clean & completely free Bootstrap 5 admin dashboard template
shinydashboard is an R package by RStudio that provides a dashboarding framework for Shiny, turning R code into an interactive admin-style web dashboard with a layout of boxes, sidebars, and value boxes.
shinydashboard is an R package that extends the Shiny web framework with a dashboard layout system. It is developed in the rstudio/shinydashboard repository and distributed on CRAN, so you can install it with install.packages("shinydashboard"). The package's full documentation is available at http://rstudio.github.io/shinydashboard/. It is described in the repository metadata as a "Shiny Dashboarding framework" and carries topics such as admin-dashboard, reactivity, and web-development, which reflect its role in building reactive, web-based admin interfaces entirely from R.
install.packages("shinydashboard"), no build from source needed.Use install.packages("shinydashboard") in R to install the package from CRAN. The installation command is shown on the repository README.
shinydashboard is an open-source R package distributed on CRAN, so it is free to use and modify. It is maintained by RStudio.
It creates web-based admin-style dashboards for Shiny applications, featuring a sidebar, header, and body area where you can place boxes, value boxes, and reactive plot outputs.
Documentation is hosted at http://rstudio.github.io/shinydashboard/, which includes examples and reference for the package's layout functions.
shinydashboard is free and open source.