Newsletter
Join the Community
Subscribe to our newsletter for the latest news and updates

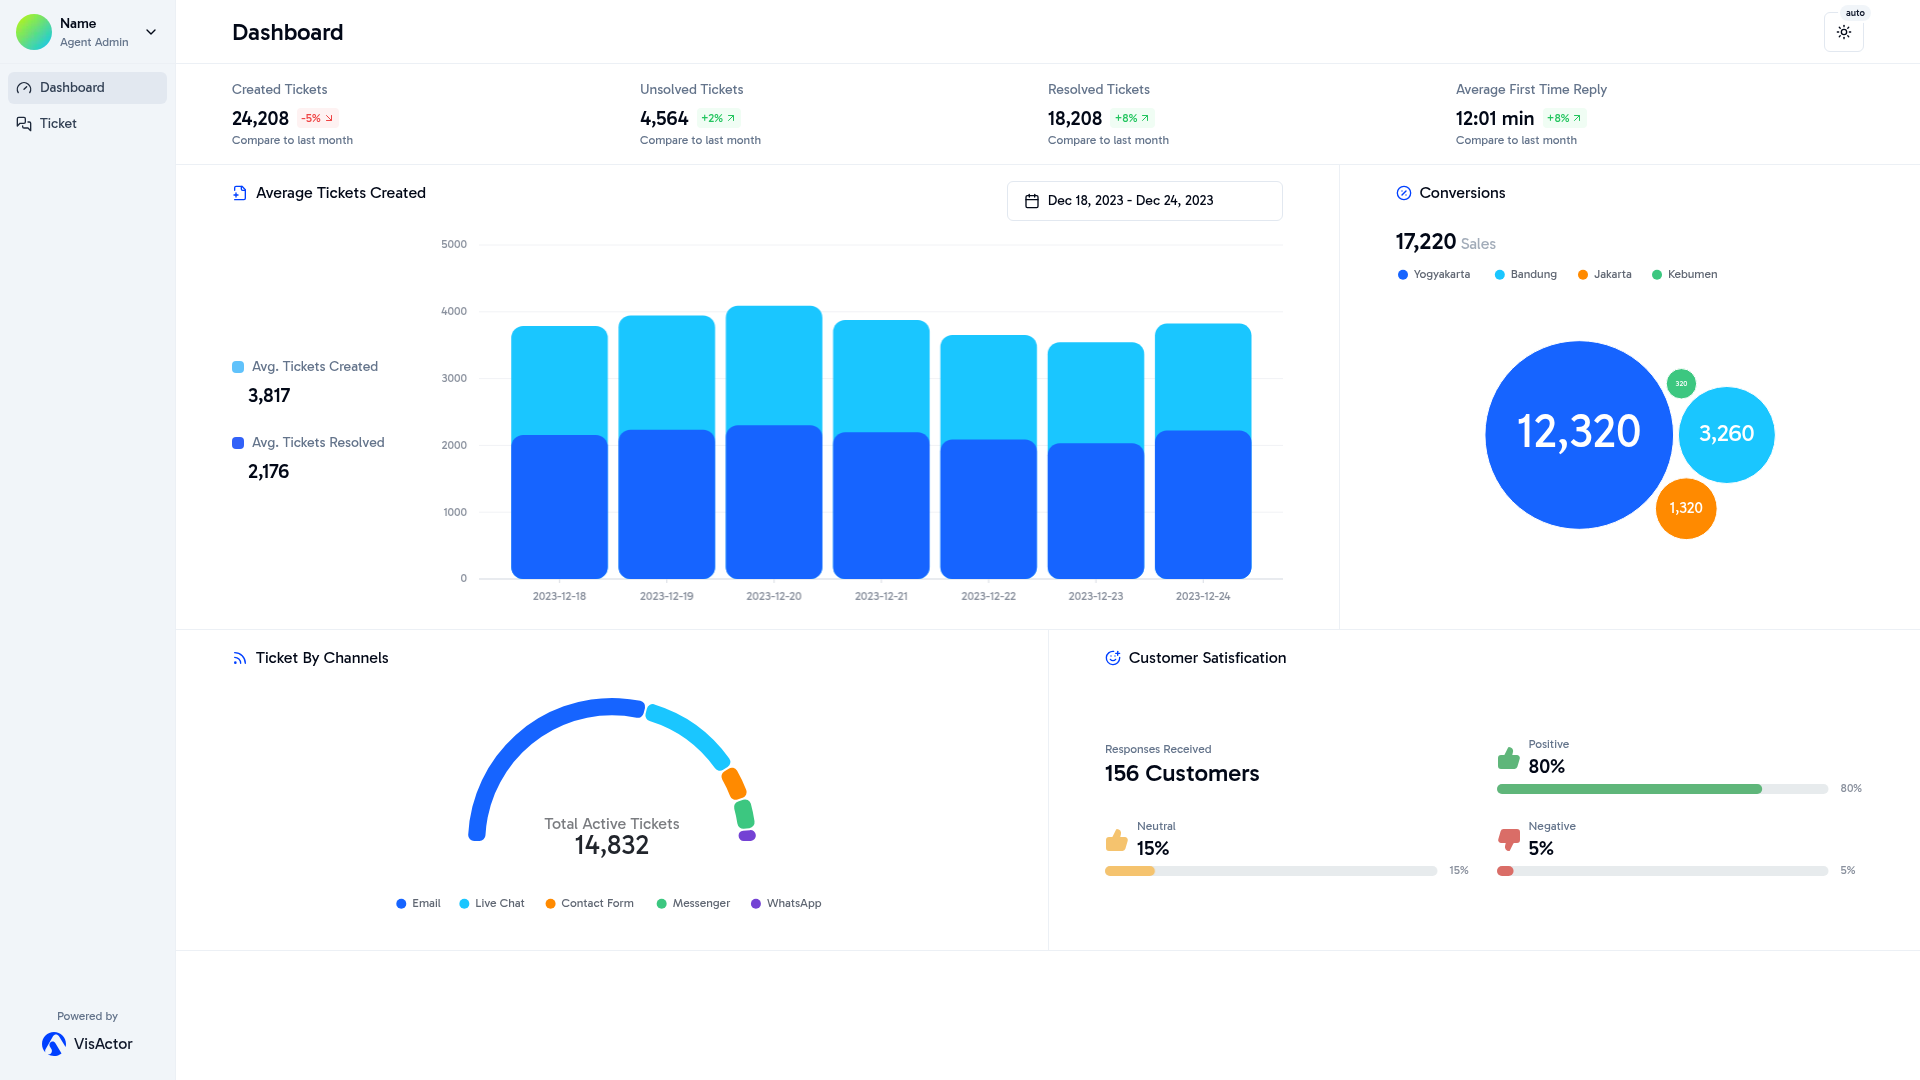
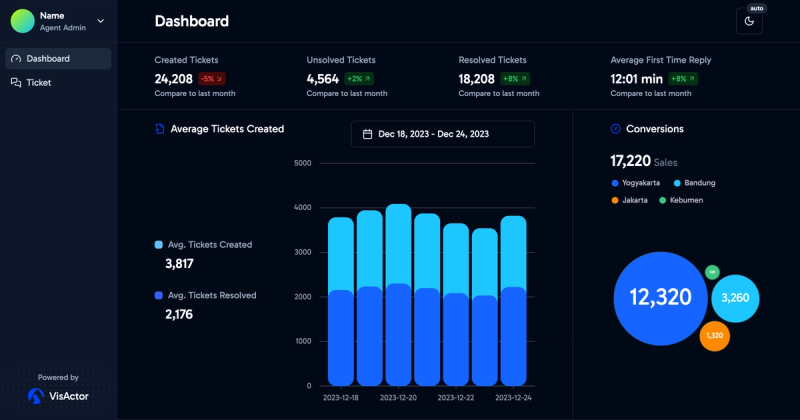
A modern dashboard built with VisActor charts, dark mode, and data visualization for seamless analytics.
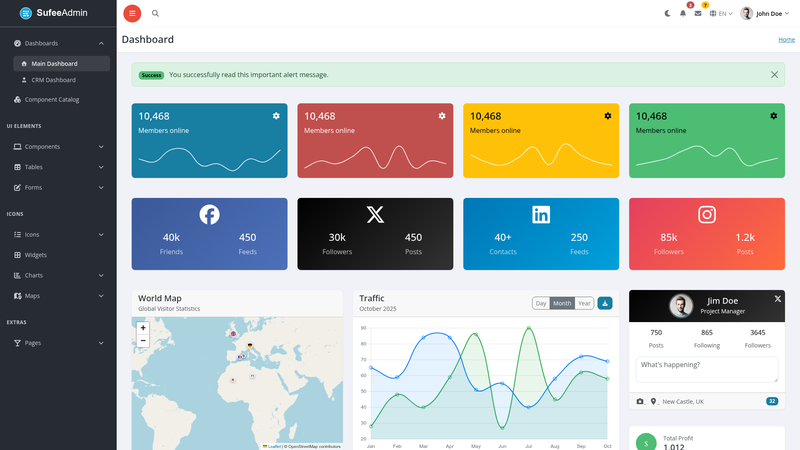
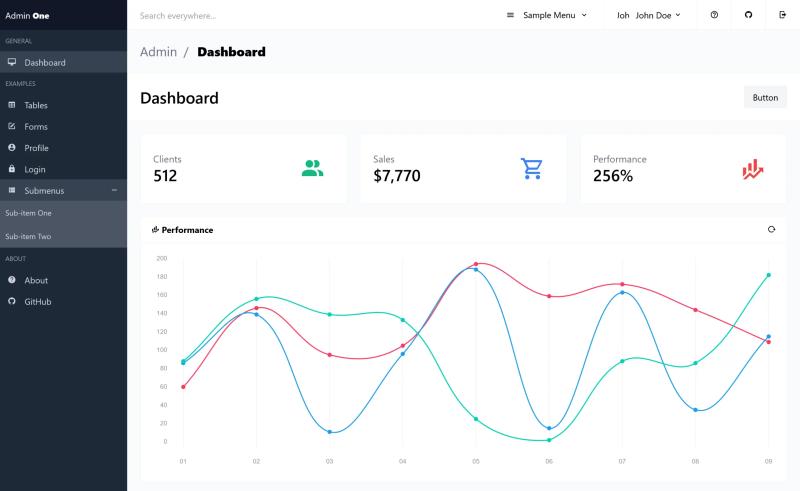
Free Bootstrap 5 admin dashboard template with Vite, dark mode, and build-time Handlebars partials.
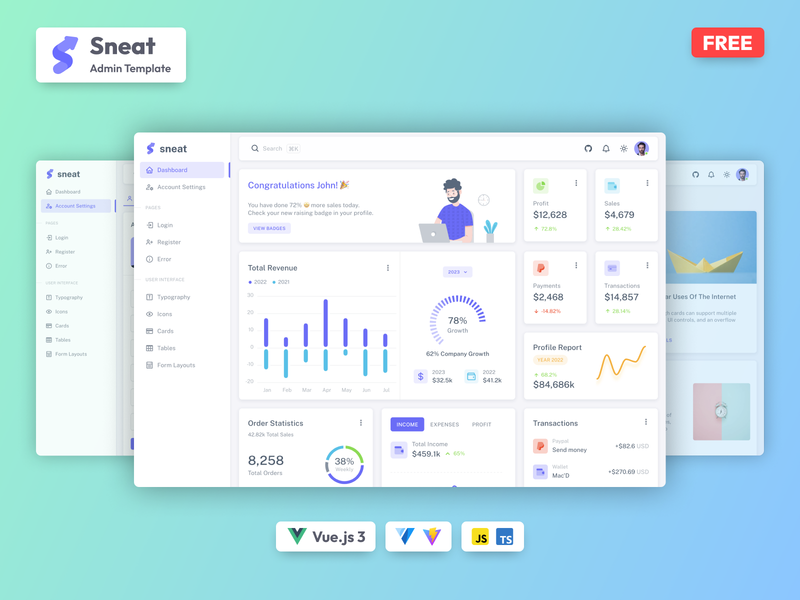
Free Vue 3 + Vuetify 3 admin dashboard template with file-based routing, auto imports, i18n, and TypeScript/JavaScript versions.
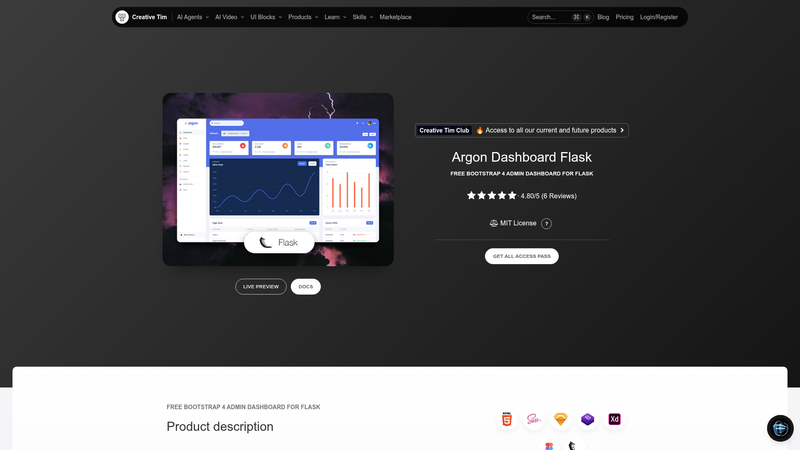
Free Flask dashboard starter with Argon UI Kit, SQLAlchemy, Blueprints, and authentication.
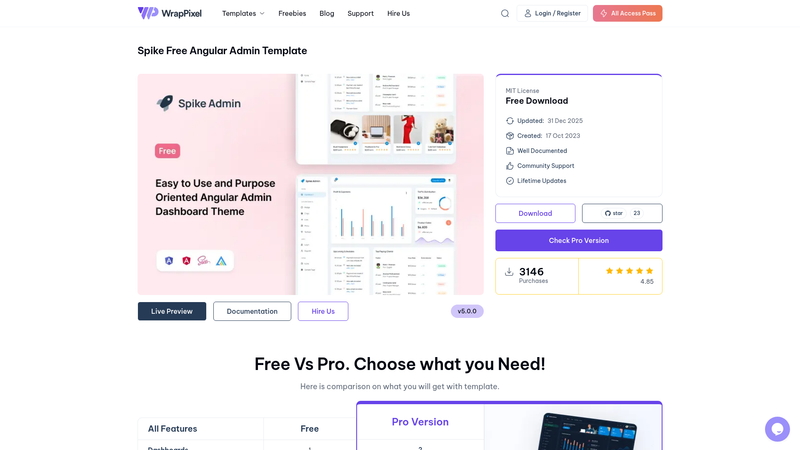
Free Angular admin template built with Angular Material and ApexCharts, fully responsive and open-source for building dashboards.
VisActor Next.js Dashboard Template is a free, MIT-licensed dashboard starter that combines the Next.js 15 App Router with the VisActor charting library to deliver a ready-to-run analytics interface. It takes sample data from a local data folder and renders it as interactive charts—bar, gauge, circle packing, and linear progress—inside a responsive Tailwind CSS layout with dark mode. The template runs on any Node.js environment, deployable to Vercel in one click, and is authored by mengxi-ream.
VisActor Next.js Dashboard Template is an open-source, MIT-licensed dashboard template built on Next.js 15 and the VisActor visualization library. It provides a structured starting point for analytics dashboards by including sample data, pre-built chart components, a responsive UI, and dark mode. The template is designed to be cloned, customized, and deployed to Vercel quickly.
The template follows a straightforward structure: sample data lives in src/data, chart components in src/components/chart-blocks render that data with VisActor, and pages in src/app compose those blocks into a dashboard layout. To run it locally, clone the repository, install dependencies with pnpm, and launch the dev server.
The template is free and open source under the MIT License, meaning you can use it for commercial projects without paying licensing fees.
Yes, the template is released under the MIT License, which permits free commercial and personal use. You only need to retain the license notice.
The template includes five chart examples: a bar chart for average tickets created, a gauge chart for ticket channels, a circle packing chart for conversions, a linear progress chart for customer satisfaction, and a metrics overview.
Yes. Sample data is stored in the src/data folder, and the chart components in src/components/chart-blocks consume it. You can swap in your own dataset and adjust the components accordingly.
Yes, dark mode is built in and respects the user's system color scheme preference. The toggle switches seamlessly between light and dark themes.
You can deploy directly to Vercel using the one-click button on the template page, or clone the GitHub repository and connect it to Vercel manually.