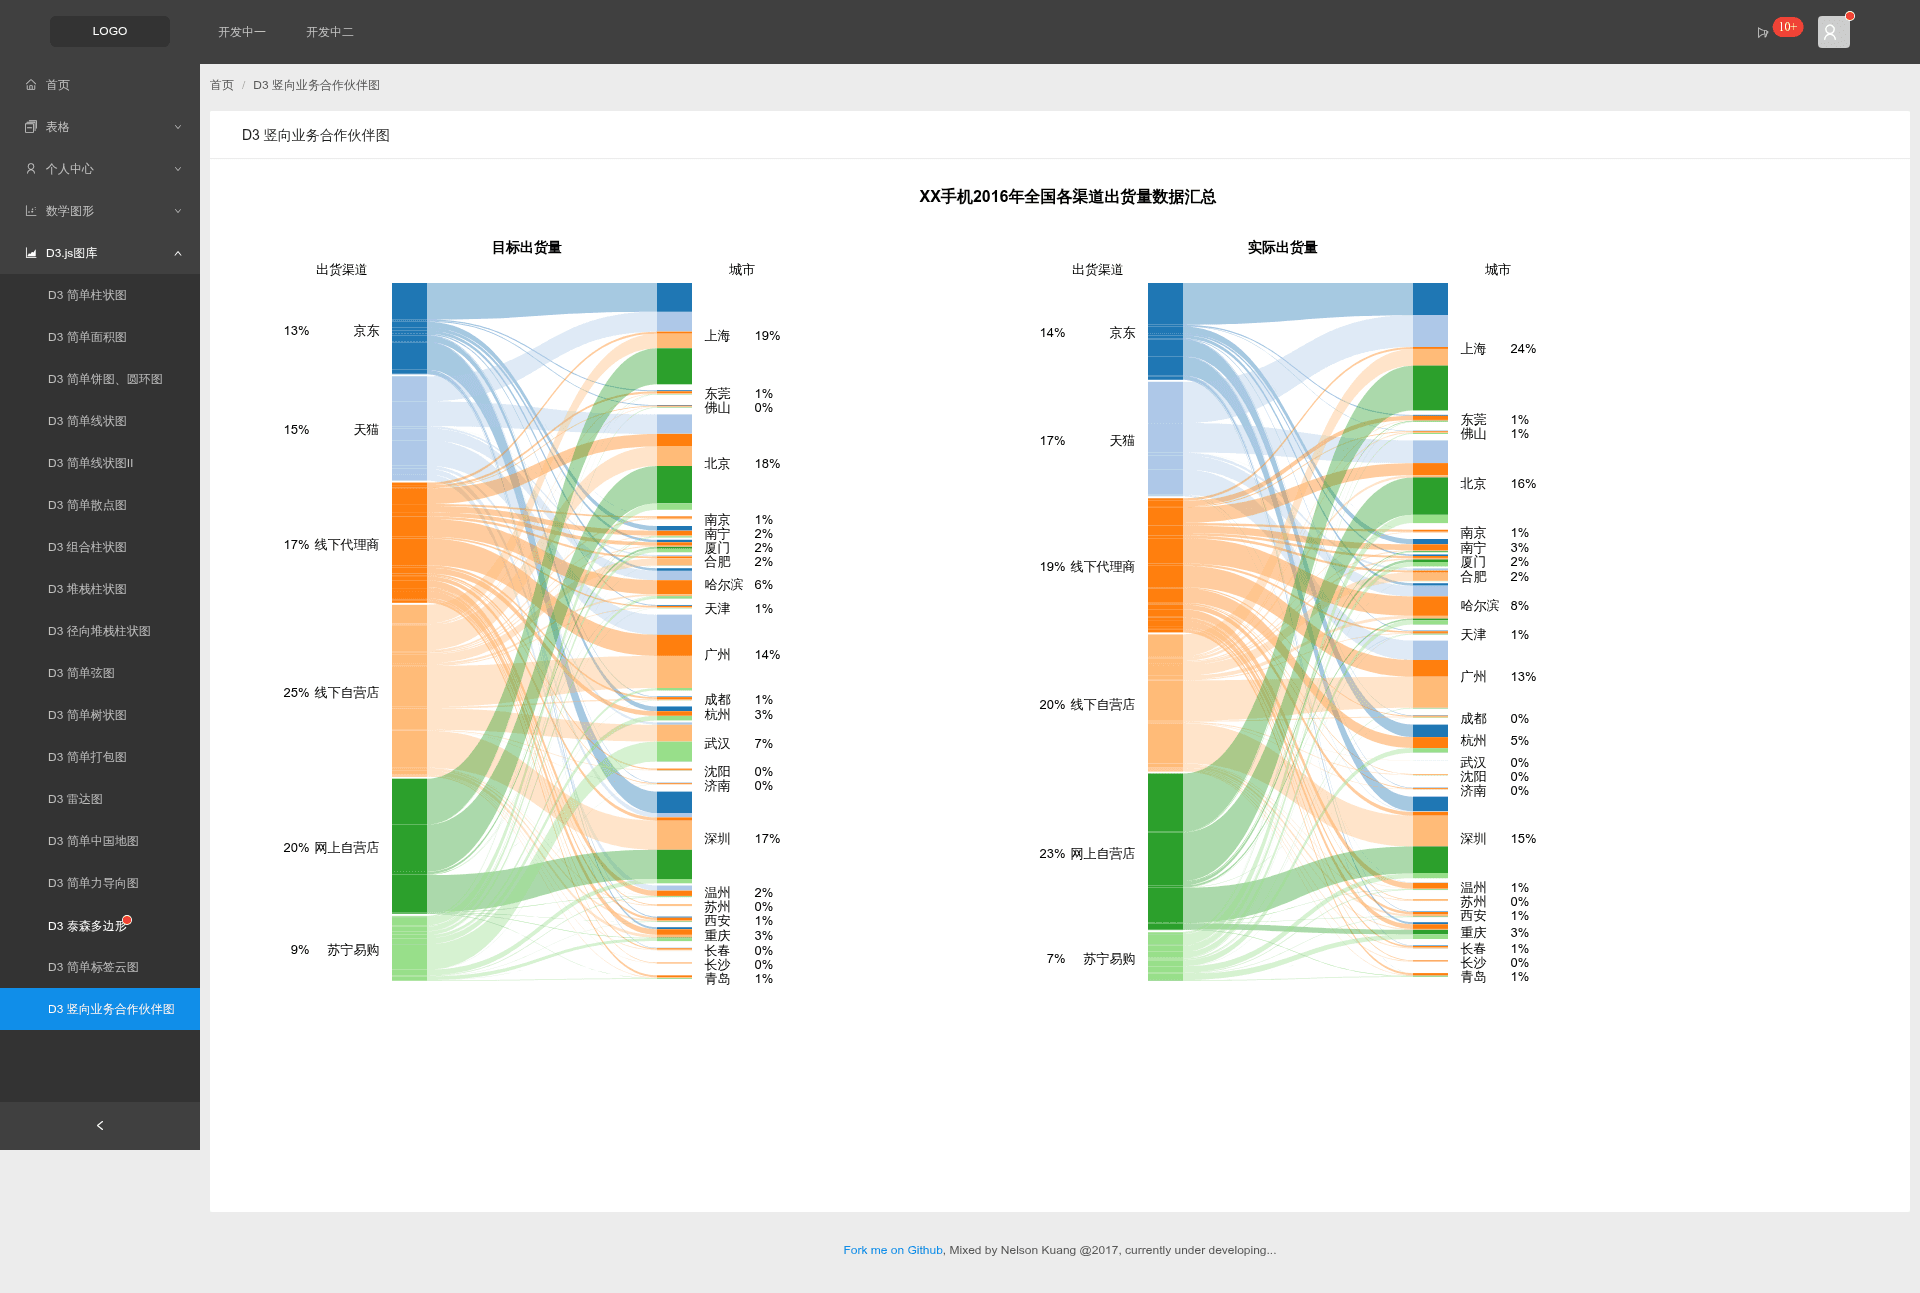

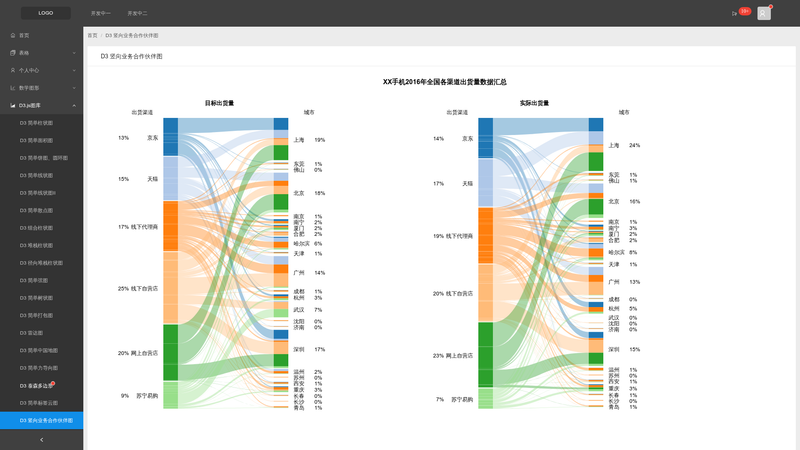
ant-admin is an open-source React admin dashboard template that pairs Ant Design (antd) UI components with D3.js data visualization, built on top of Create React App. It gives you a runnable starting point for building backend management interfaces, complete with at least one D3 chart sample (a vertical BP chart) that you can view in the hosted demo. The project is MIT-licensed and the repository has collected roughly 585 stars.
What is ant-admin?
ant-admin is a React-based admin platform template that uses the Ant Design component library for its interface and adds D3.js for custom charts. It starts as a standard Create React App project, so you get the familiar npm and yarn scripts for development, testing, and production builds. The template's output is a functional admin dashboard that can be extended with your own pages and data, and it comes with a hosted demonstration at http://www.a4z.cn/pui/ant-admin.html#/vertical-bp-chart. The original repository is owned by nelsonkuang, and a newer version is being maintained in the tubiejs/Diy-Ur-D3-Charts repository.
Key Features
- Ant Design integration — The whole UI is built with antd, giving you ready-made tables, forms, navigation, and layout components that follow Ant Design's design language.
- D3.js chart examples — Includes D3 v4 (d3v4) chart demos, with the vertical BP chart visible in the online demo, illustrating how to embed D3-generated SVG visuals inside React components.
- Create React App foundation — Project was initialized with Create React App, meaning the standard scripts (
npm start,npm test,npm run build,npm run eject) work out of the box, and the same commands are available via yarn. - MIT open-source license — The template is free to use, modify, and redistribute, for both personal and commercial projects, under the MIT license.
- Online live demo — A public demo at a4z.cn lets you explore the vertical BP chart and surrounding admin pages before downloading the source.
- Helpful references — The README points to mbostock's D3 blocks and the react-admin repository as reference material for chart and admin UI patterns.
Who is it for?
- React developers building admin panels — who want a beginning layout with Ant Design and want to see how D3.js can be integrated for custom charts.
- Front-end teams needing a starter scaffold — who can clone ant-admin, run
npm start, and get a working dashboard to customize for their own backend. - Data visualization learners — who want to study a real React + D3 integration using the bundled vertical BP chart and the linked mbostock examples.
What can you do with ant-admin?
- Prototype an admin dashboard — start from the included pages and charts, then swap in your own data sources and API calls.
- Learn D3 integration in React — inspect how the template structures D3 v4 code within React components by exploring the vertical BP chart example.
- Create business data charts — adapt the vertical BP chart pattern for time-series metrics like patient blood pressure, server load, or sales trends.
How do you run ant-admin?
Clone the repository and run npm start (or yarn start) to launch the development server through Create React App. npm test / yarn test runs the test suite, and npm run build / yarn build generates a production bundle. If you need full control over the webpack and Babel configuration, npm run eject or yarn eject will expose those files.
Pricing
ant-admin is free to use under the MIT license, with no paid tiers or license fees for open-source or commercial usage.
Alternatives
react-admin, a separate React admin framework that provides a data-provider abstraction for REST and GraphQL APIs and is also open-source.
FAQ
Is ant-admin free?
Yes. The project is released under the MIT license, so you can use it freely in personal and commercial projects without paying licensing fees.
What tech stack does ant-admin use?
It uses React as the framework, Ant Design (antd) for UI components, and D3.js for data-driven charts. The project is built with Create React App, and the repository topics also mention ECharts as an additional charting option.
Does ant-admin include D3.js examples?
Yes, the online demo shows a vertical BP chart at the #/vertical-bp-chart route, and the README references mbostock's D3 blocks as inspiration for the chart code.
How do I start developing with ant-admin?
After cloning, run npm start or yarn start to launch the development server. Use npm run build or yarn build to create an optimized production build.
Can I eject the configuration?
Yes, because it's a Create React App project, you can run npm run eject or yarn eject to get full access to the underlying build configuration, including webpack, Babel, and ESLint setups.