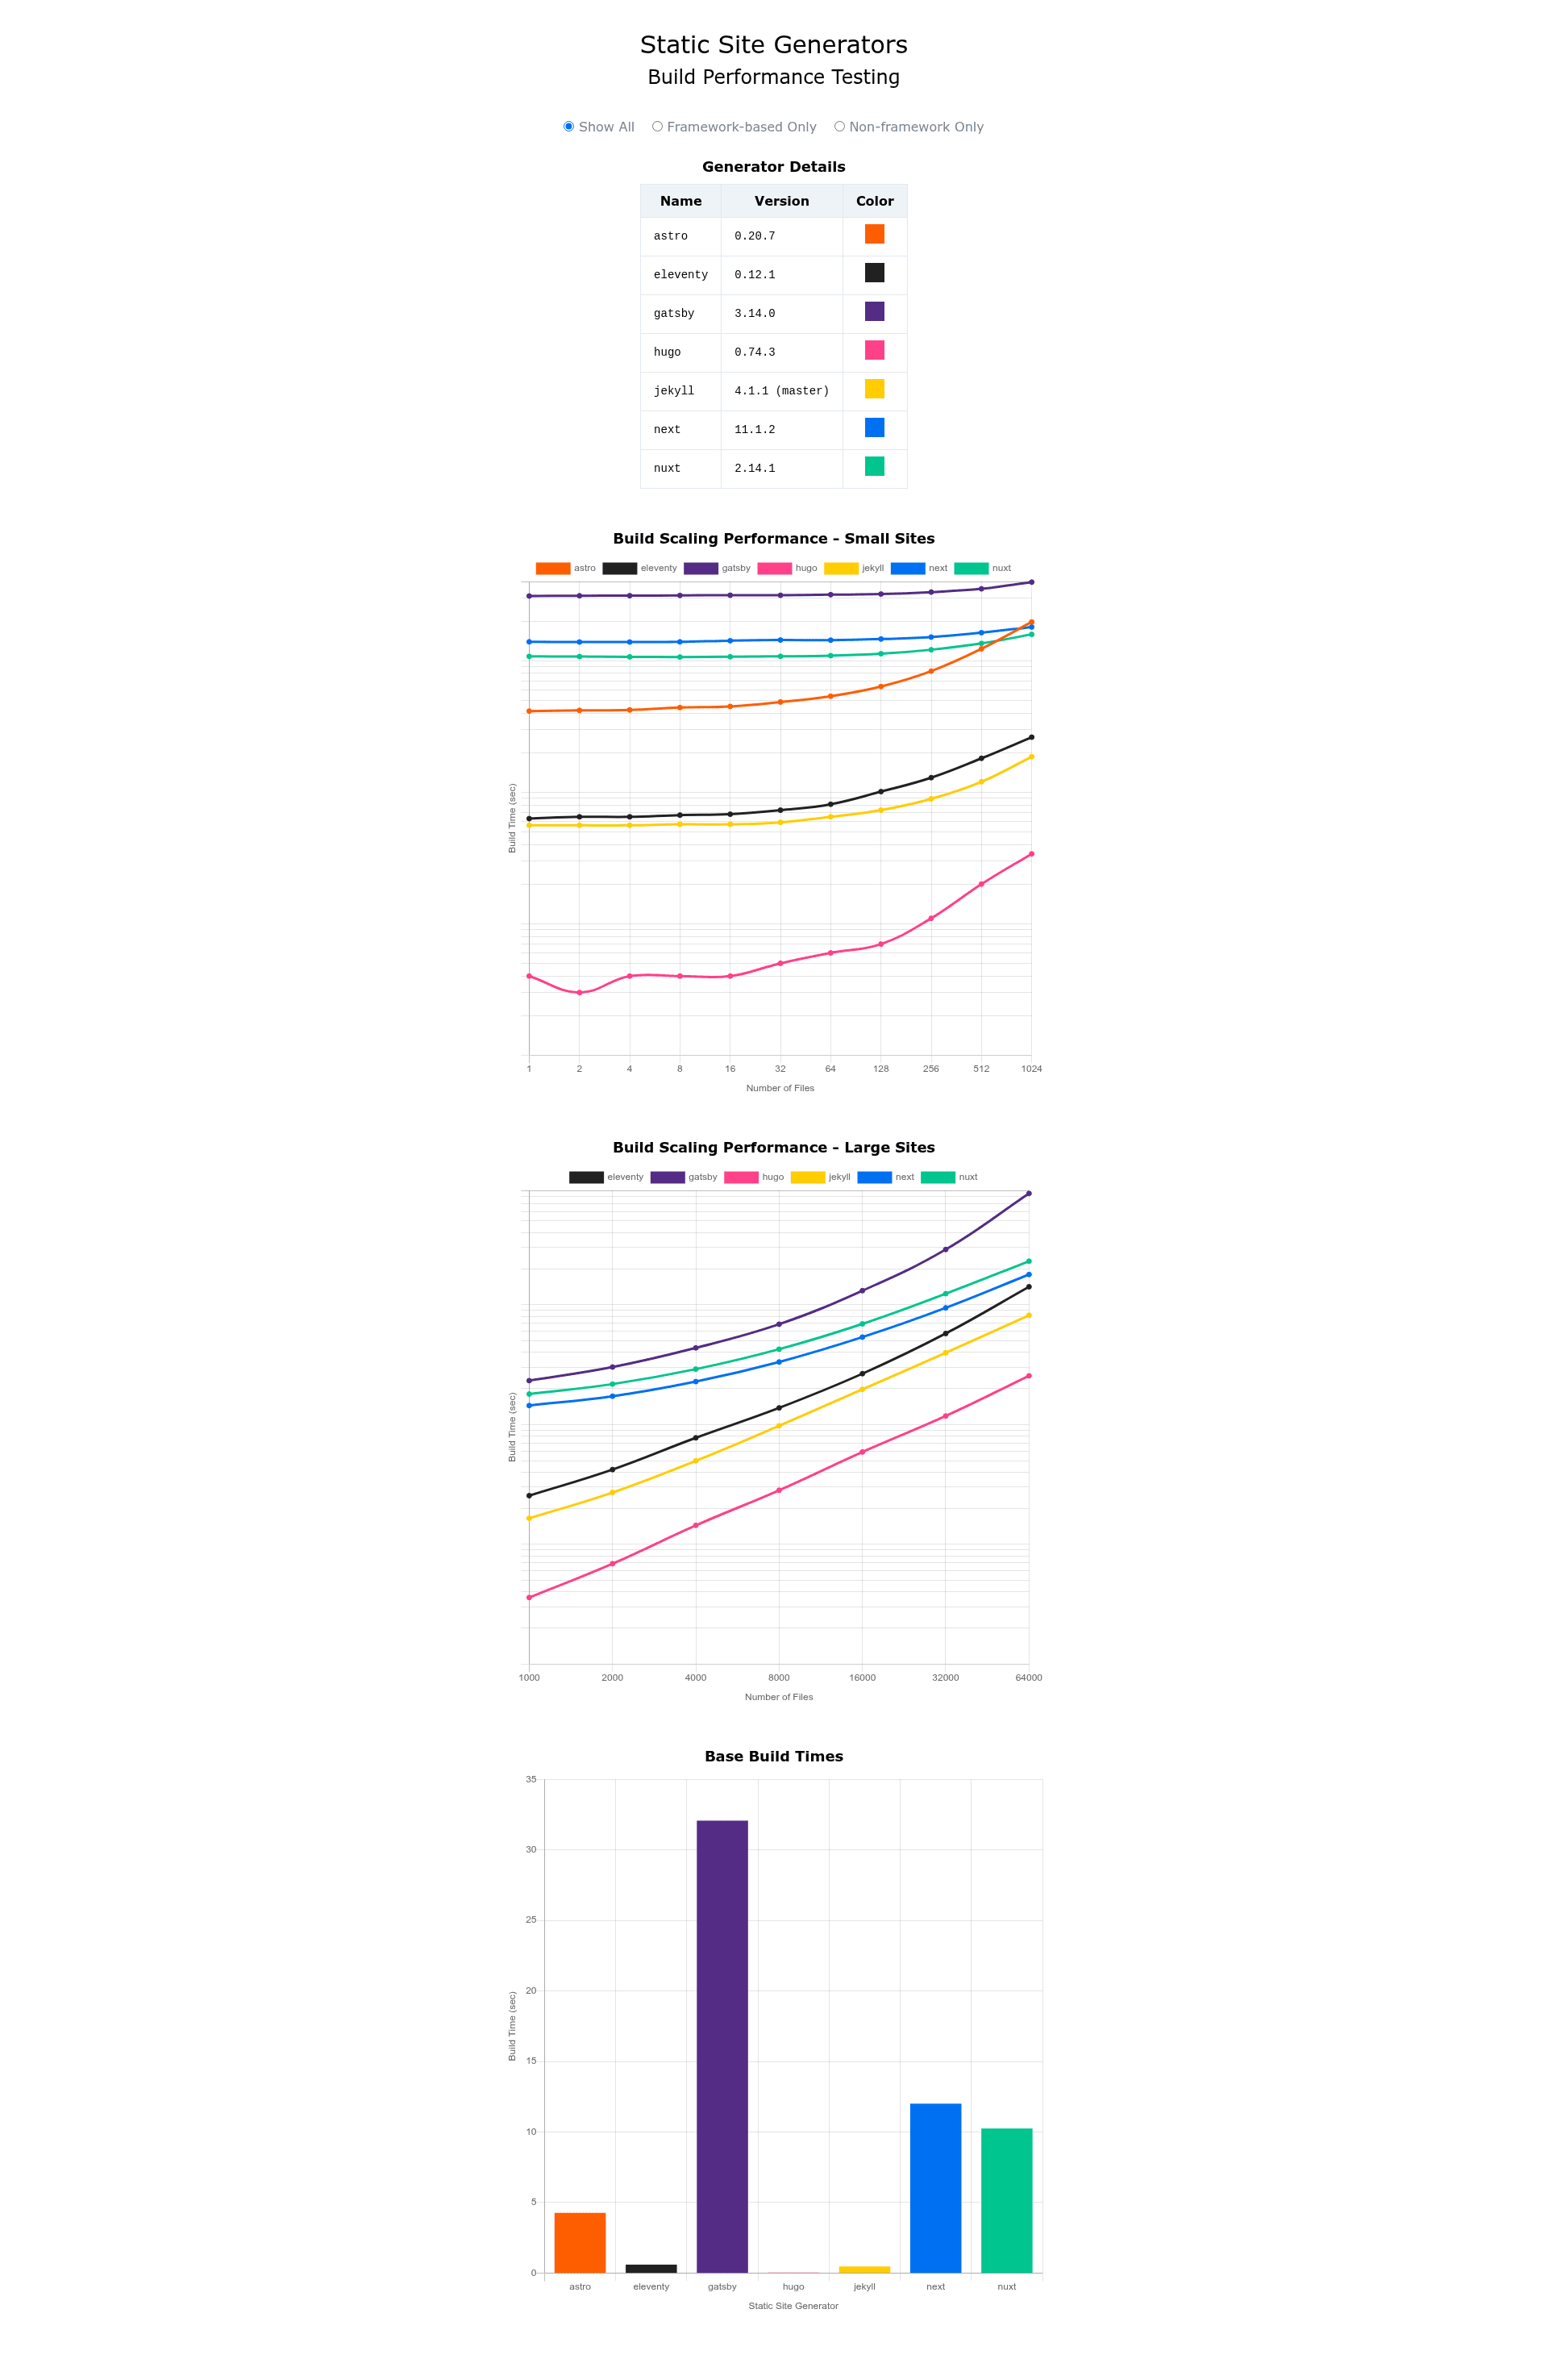

SSG Build Performance Comparison is an open-source benchmarking project that measures how popular static site generators perform when building 64,000 pages from local markdown files.
What is SSG Build Performance Comparison?
It is a research and benchmarking project by Sean C. Davis, originally published as a CSS-Tricks article. It takes a set of local markdown files as its input data source and tasks each static site generator with generating 64,000 static pages, then records build times. The results are hosted live on Netlify, and the code is available on GitHub. The project is no longer maintained, but the most recent results remain active.
Key Features
- Multi-framework comparison — Tests popular SSGs under identical workloads, processing local markdown files.
- Large-scale test — Each framework is asked to generate 64,000 static pages, exposing real-world build bottlenecks.
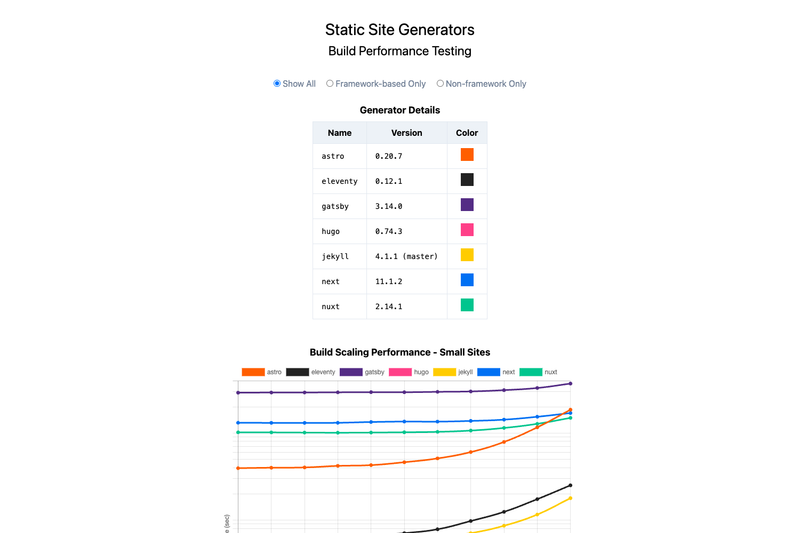
- Live results — Build times are published at ssg-build-performance-tests.netlify.app for side-by-side review.
- Open-source code — The full test harness is on GitHub under the seancdavis/ssg-build-performance-tests repository.
- Research-backed — Accompanied by a CSS-Tricks article explaining the methodology and findings.
- Historical relevance — Reflects the 2018–2020 era when SSG build performance was a top concern; the maintainer now notes that static generation is rarely chosen for 64,000-page frequent builds.
Who is it for?
- Static site developers — Compare build times across SSGs to inform framework selection for content-heavy sites.
- Technical architects — Evaluate whether static generation can scale to large page counts before committing to an SSG.
- DevOps engineers — Use the benchmark methodology to design their own performance tests for JAMstack pipelines.
What can you do with it?
- Developers: Run the test suite locally against your own markdown content to see how different SSGs handle your data volume.
- Technical writers: Reference the published results to justify SSG recommendations in documentation or blog posts.
- Framework maintainers: Identify performance regressions or improvements by comparing your SSG against the benchmark numbers.
How does it work?
The benchmark feeds a common set of local markdown files to each static site generator and instructs it to generate 64,000 pages. Build times are measured for each generator and the results are aggregated and displayed. The code is structured so that additional SSGs could be added by extending the test harness, though the project is no longer actively maintained.
Pros and cons
- Pros: Provides concrete, reproducible build-time data for multiple SSGs under a heavy workload; fully open source.
- Cons: No longer maintained; the maintainer explains that the comparison has lost relevance because decoupled, API-driven sites and evolving rendering patterns have made static generation for 64,000-page frequent builds uncommon.
FAQ
Is SSG Build Performance Comparison still maintained?
No. The project is no longer being maintained, as stated in its README. However, the most recent build performance results remain available at ssg-build-performance-tests.netlify.app.
How many pages are generated in the test?
Each popular static site generator is tasked with generating 64,000 static pages from local markdown files, which creates a heavy workload that exposes build performance differences.
Can I run the benchmark myself?
Yes. The code is open source and available on GitHub. A previous README with instructions is linked from the project to help you tinker with the tests.
Where can I see the results?
The results are hosted live at https://ssg-build-performance-tests.netlify.app/. Build times for each generator are displayed there for comparison.