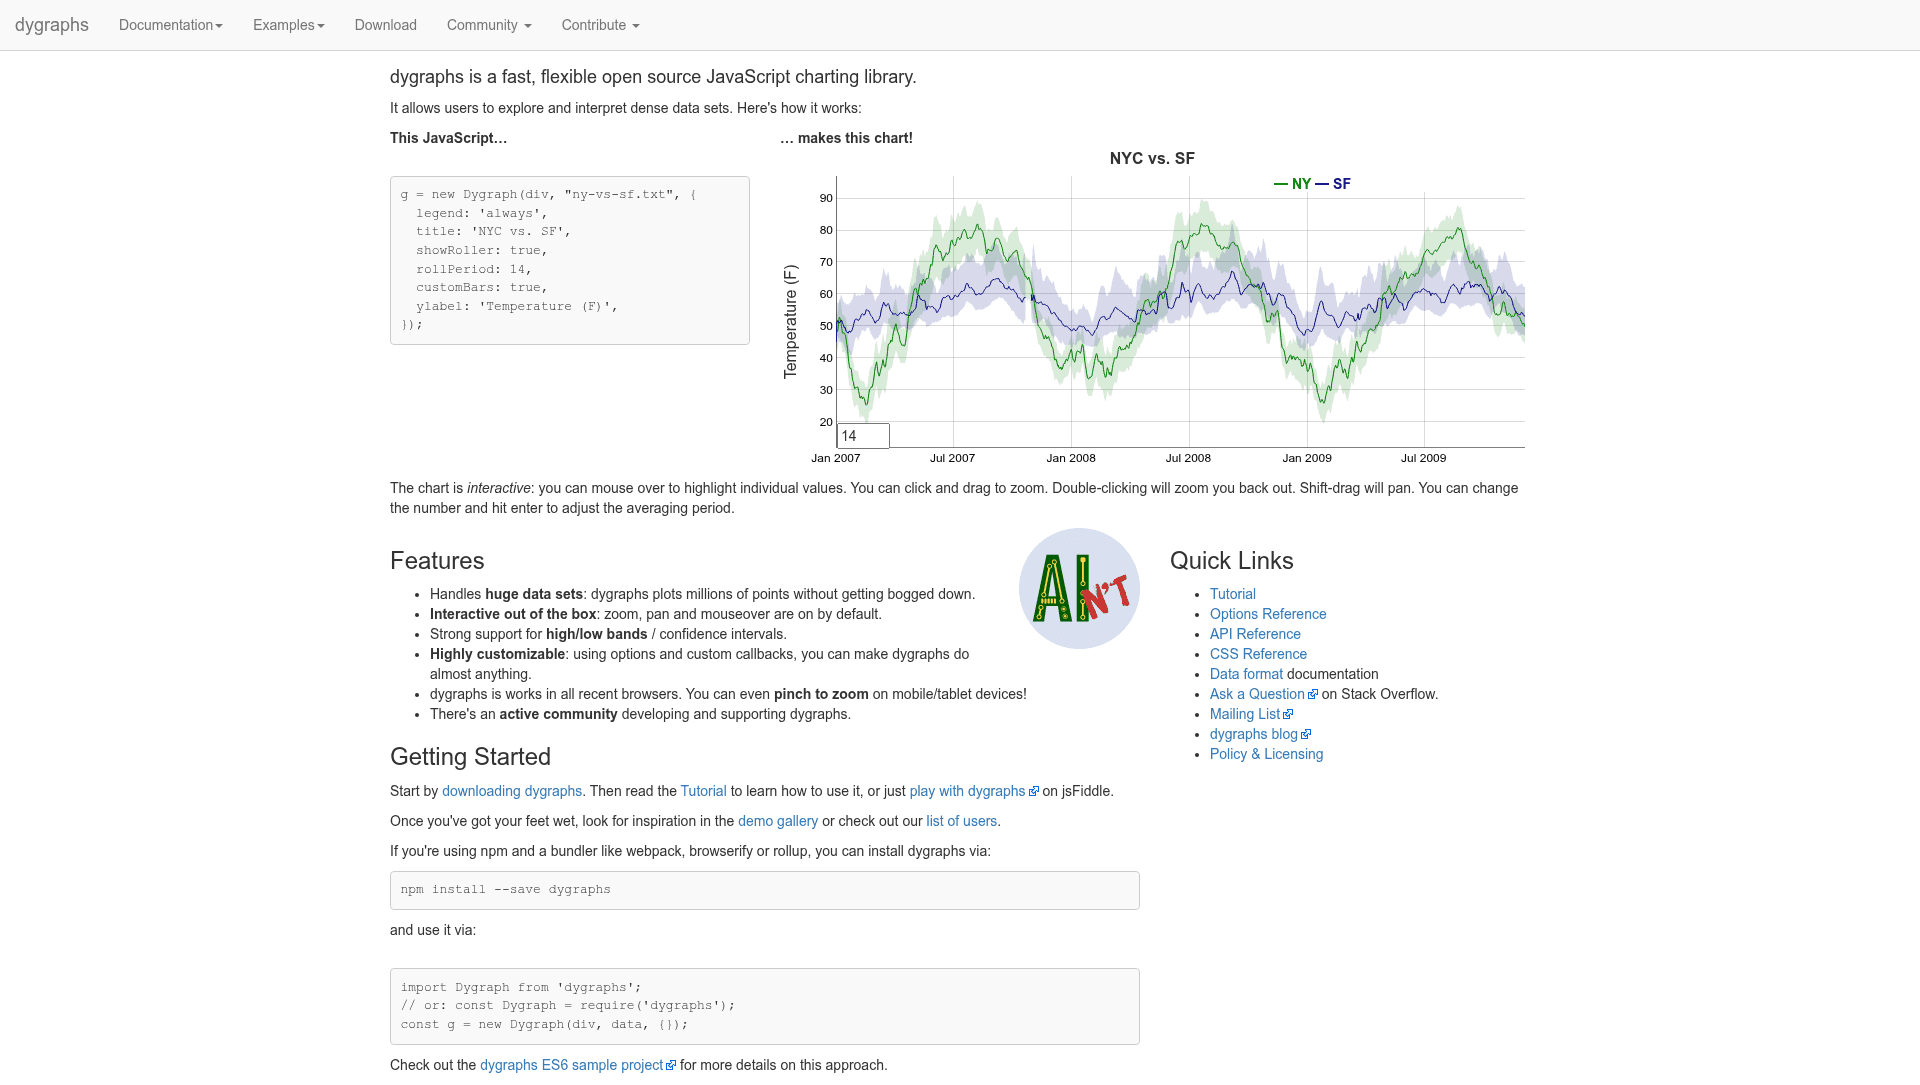

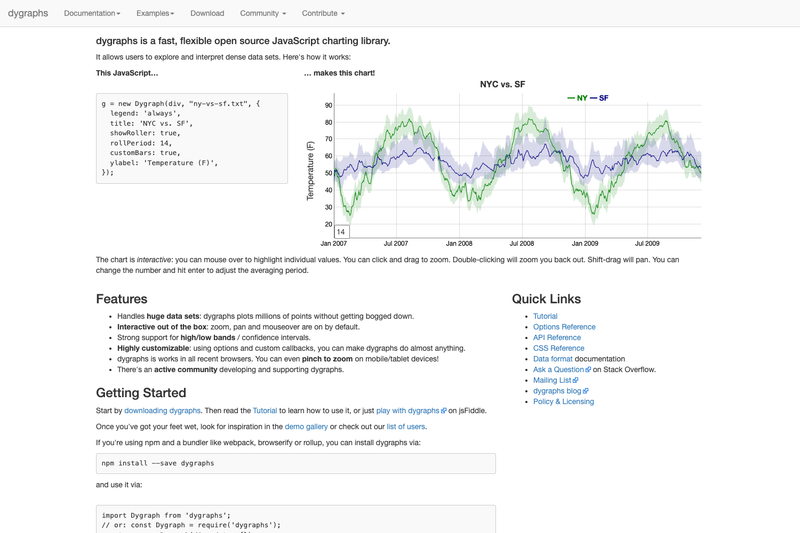
Dygraphs is a JavaScript charting library that renders interactive, zoomable time-series charts in the browser using the HTML canvas tag.
What is Dygraphs?
Dygraphs is a JavaScript charting library that plots time-series data directly in the browser without requiring an external server or Flash. It takes data as CSV-formatted strings, JavaScript arrays, or Google DataTable objects and produces interactive charts with pan and zoom, mouseover value display, and error-band support. The library is open-source under the MIT license and maintained on GitHub by danvk and contributors.
Key Features
Dygraphs provides a focused set of features tailored for time-series visualization, all working without server-side dependencies.
- No server or Flash required — Plots time series entirely client-side using the HTML canvas tag; data can be embedded as strings or arrays.
- Error bands — Visualize uncertainty or range around data series with dedicated support (see tests/legend-values.html).
- Interactive pan and zoom — Users can pan and zoom through time ranges, with linked interaction across multiple charts (tests/link-interaction.html).
- Mouseover values — Hovering over a chart displays data values at that point (tests/legend-values.html).
- Adjustable averaging period — Aggregates data over a configurable period to smooth noise (tests/temperature-sf-ny.html).
- Extensive options — A large set of options for customizing appearance and behavior (options.html).
- Google Visualization API compatible — Works with Google's DataTable format, enabling integration with Google Charts (data.html#datatable).
- Modular usage — Installable via npm as
dygraphs; import as an ES module withimport Dygraph from 'dygraphs'or require it. Prebuilt files are innode_modules/dygraphs/dist/.
Who is it for?
Dygraphs is aimed at developers who need to visualize time-series data in web applications. It is well-suited for dashboards, data analytics tools, and financial or scientific charts. Researchers and analysts can use it to create interactive exploratory plots from CSV data with minimal code. Front-end engineers can integrate it with module bundlers like browserify or webpack, and even use it in ES6 projects via the dygraphs-es6 repository.
What can you do with Dygraphs?
Dygraphs' features translate into several concrete use cases across industries:
- Dashboard developers: Embed interactive time-series charts in a dashboard UI with pan, zoom, and mouseover tooltips, using the extensive options to match the look and feel.
- Data journalists: Create zoomable charts from CSV data (e.g., temperature readings) to let readers explore trends and anomalies.
- Finance analysts: Plot price series with error bands to show volatility or confidence intervals, and link multiple charts for coordinated exploration.
- Educators: Demonstrate time-series concepts with interactive examples, leveraging the gallery of demos to illustrate different chart styles.
How does Dygraphs work?
The library is simple to set up: include dygraph.js and dygraph.css in your page, or install via npm with npm install dygraphs. Then create a chart by passing a container element (or its ID) and the data as a string in CSV format, a JavaScript array, or a Google DataTable, along with an options object. Dygraphs handles the rest, rendering on the HTML canvas and managing interactions. The minimal example in the README shows constructing a Dygraph inside Dygraph.onDOMready().
Pros and cons
- Pros: Lightweight (no external dependencies), works on all modern browsers, MIT licensed, well-documented with a gallery and tutorial, and actively supported on Stack Overflow and Google Groups.
- Cons: The README warns not to install from the git repository because npm fails to build source from GitHub; always use a tarball install or the prebuilt dist files. Additionally, the project explicitly discourages contributions made with AI/LLM tools, which may affect some prospective contributors.
Pricing
Dygraphs is free and open-source under the MIT license.
Alternatives
- Chart.js, which offers a broader range of chart types but is not specialized for time series.
- D3.js, which provides lower-level primitives for building custom visualizations.
- Highcharts, a commercial library with extensive interactivity but a paid license for many use cases.
FAQ
Does Dygraphs require a server or Flash?
No, Dygraphs runs entirely in the browser using the HTML canvas element. It does not require an external server or Flash.
How do I install Dygraphs?
You can install it via npm with npm install dygraphs. The package includes pre-built files in node_modules/dygraphs/dist/. You can also load it from CDNs like UNPKG, jsDelivr, or cdnjs.
Can I use Dygraphs with a module bundler?
Yes, Dygraphs can be imported as an ES module (import Dygraph from 'dygraphs' or const Dygraph = require('dygraphs')) and works with bundlers like browserify and webpack.
Is Dygraphs free to use?
Yes, Dygraphs is released under the MIT license, which permits free commercial and personal use.
Can I contribute to Dygraphs?
The project is open-source on GitHub, but it explicitly states that contributions prepared with AI or LLMs are not welcome. It also warns against installing from the git repository for builds; use the tarball install instead.